Electronic Design Automation – Virtual Prototyping / Digital and Analogue Circuits
Understand – Analyse — Debug — from inside of your IDE.
Waveform Analysis
The Foundation of Digital Design
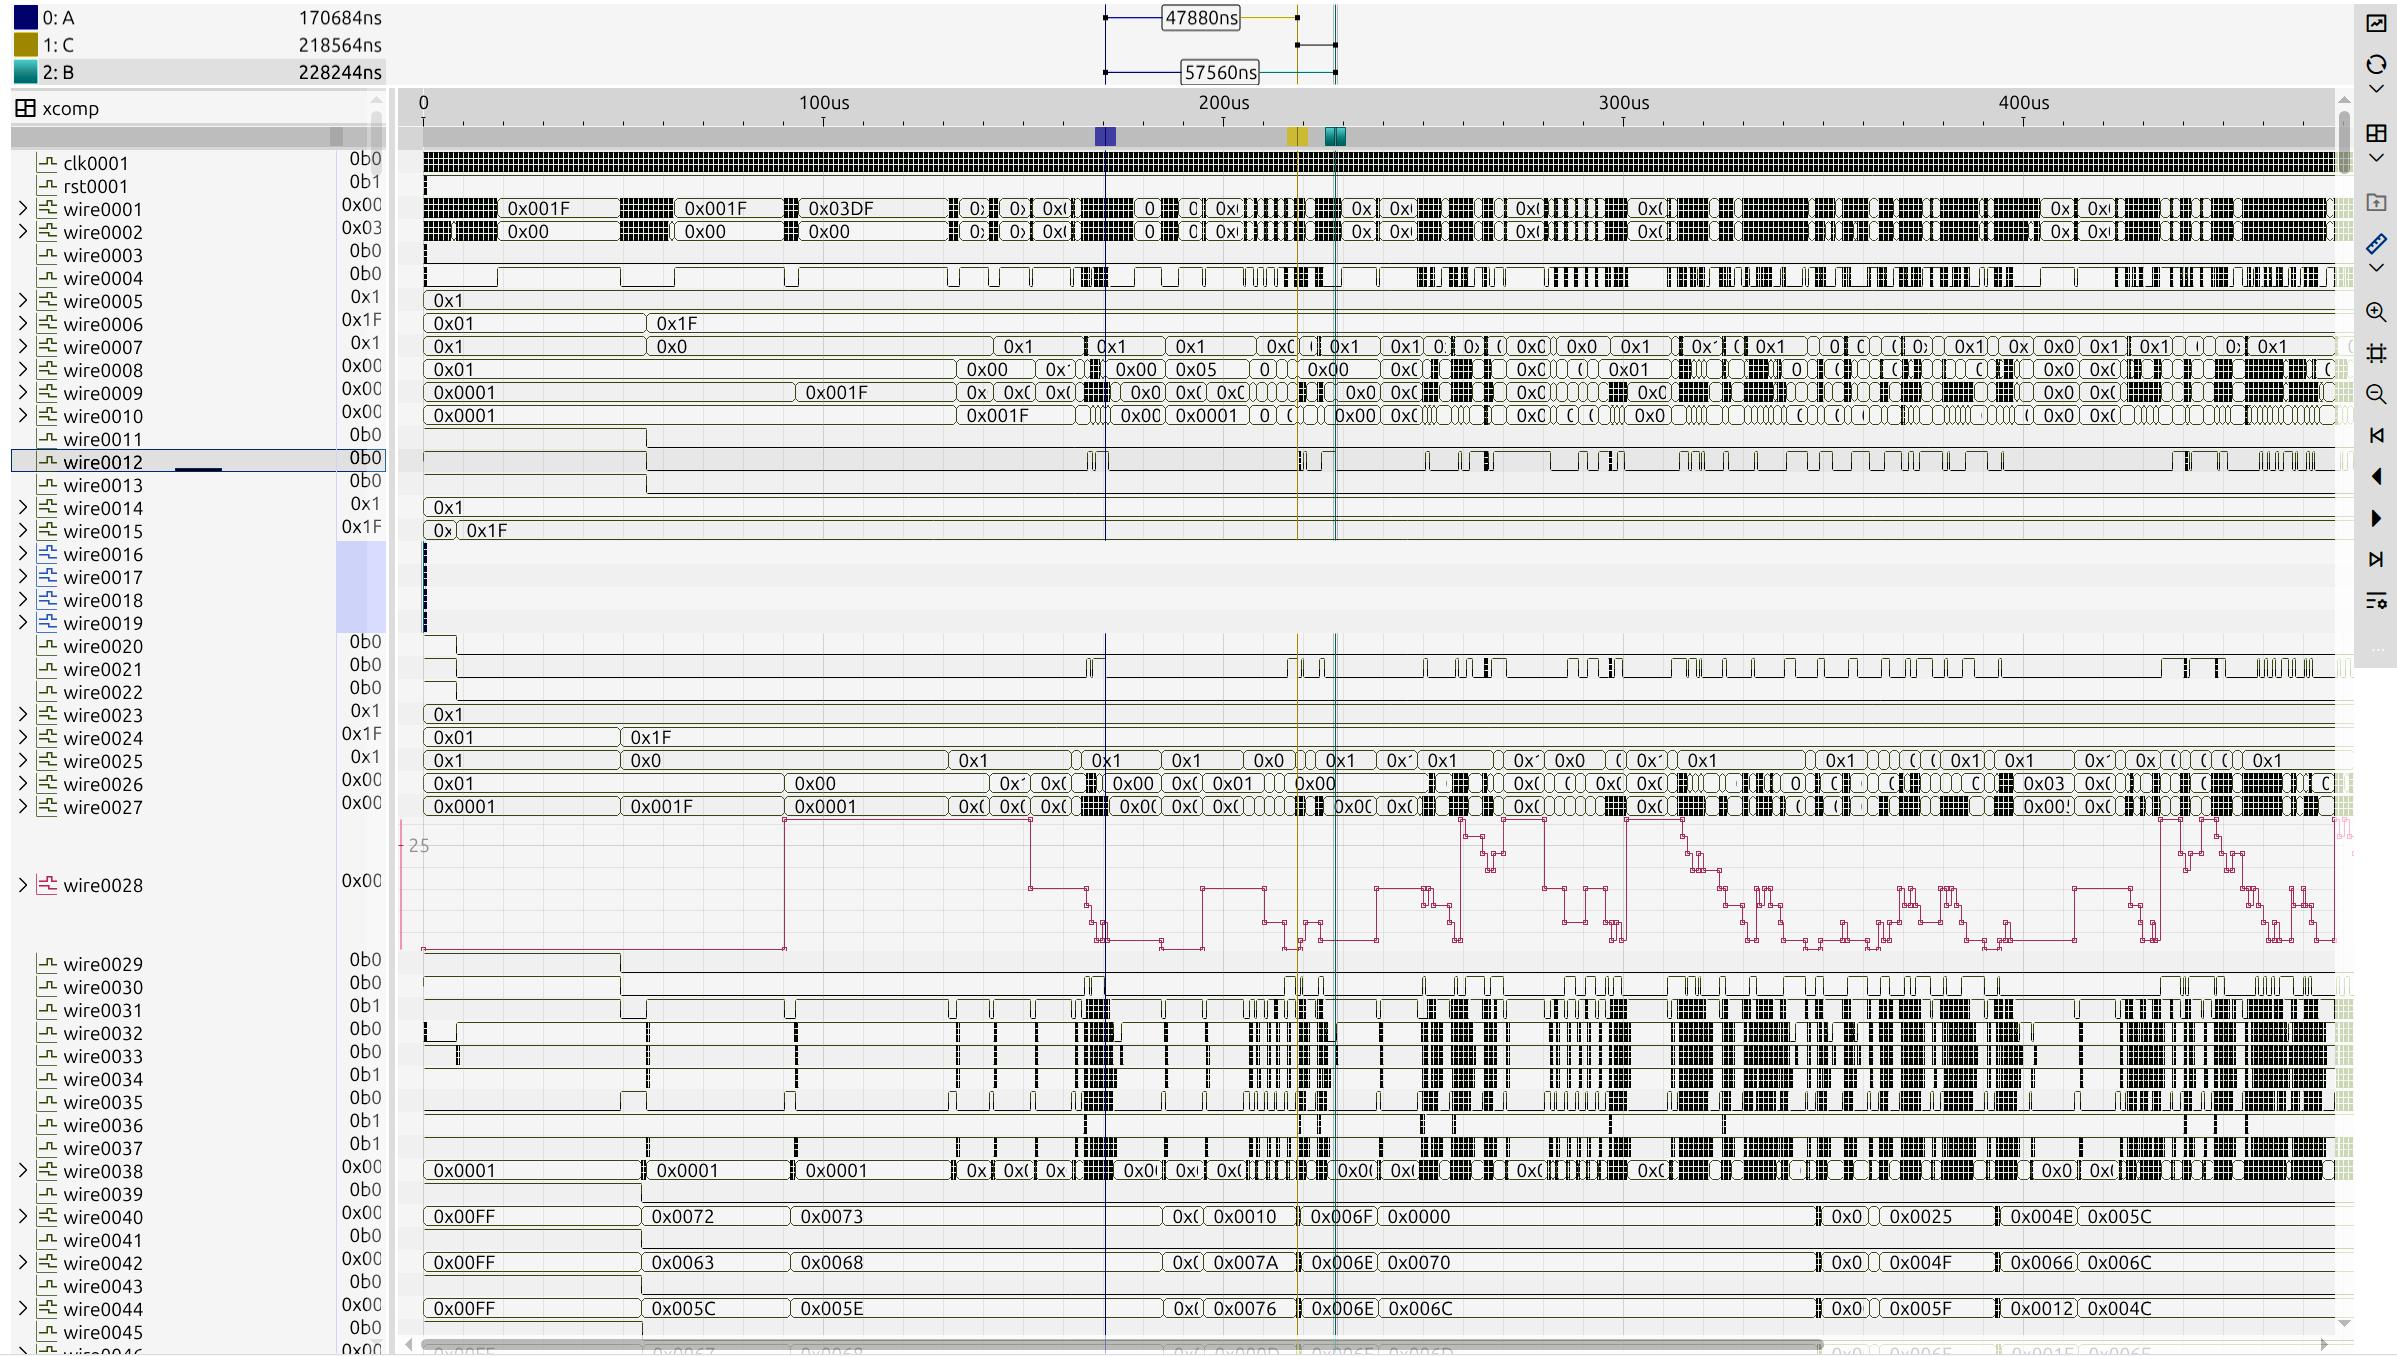
At the heart of every digital design workflow lies waveform analysis. Engineers spend countless hours examining signal transitions, debugging timing issues, and investigating functional problems. Traditional waveform viewers, while essential for basic visualization, often struggle with the scale and complexity of modern semiconductor designs. impulse integrates industry-standard EDA waveform formats, preserving design hierarchies and enabling advanced filtering, cross-domain visualization, and real-time analysis. Whether debugging multi-million cycle RTL simulations or investigating analog mixed-signal behavior, impulse provides the flexibility needed for modern complex designs. Engineers can correlate events across clock domains, measure precise timing relationships, identify signal glitches, and validate protocol sequences. Advanced filtering capabilities extend beyond simple name matching to include value-based queries and hierarchical pattern matching, supporting seamless integration with all major simulation tools.

Acquire Waveform Data from multiple sources
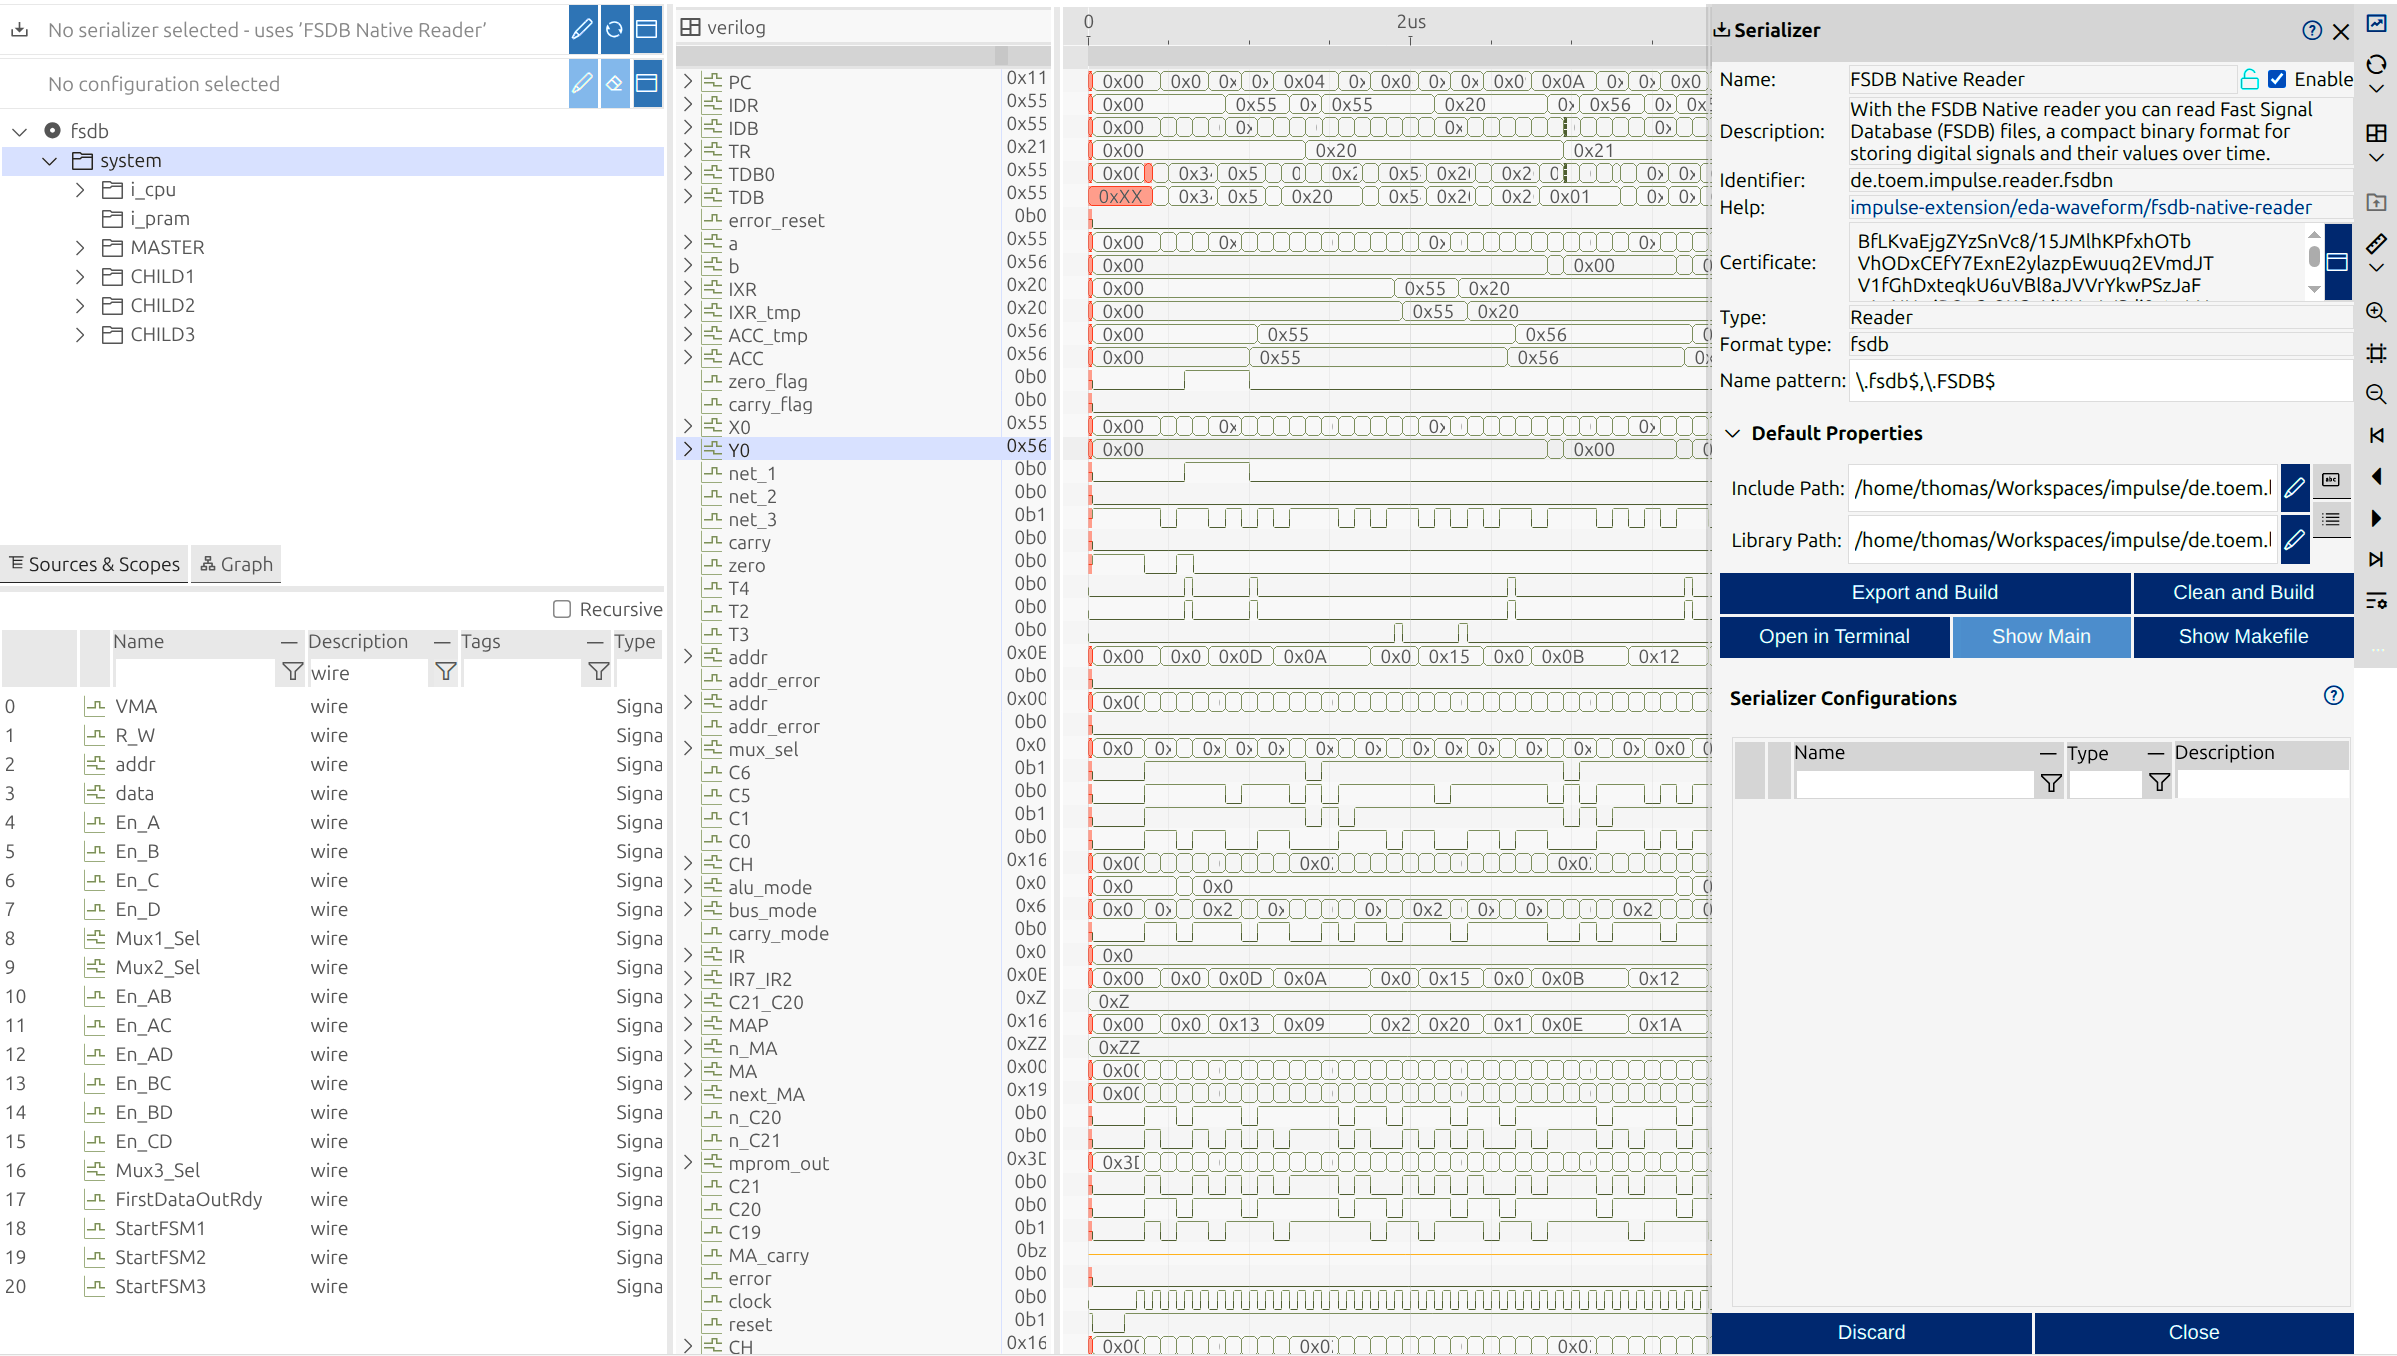
Open waveform files from simulation outputs with automatic format detection and preserved hierarchies. Connect to live simulation streams for real-time analysis without waiting for completion. Combine data from multiple sources—merge gate-level and RTL simulations, synchronize analog and digital outputs, or align results from different testbenches—creating unified views for comprehensive debugging across tools and abstraction levels.
Customize and Correlate
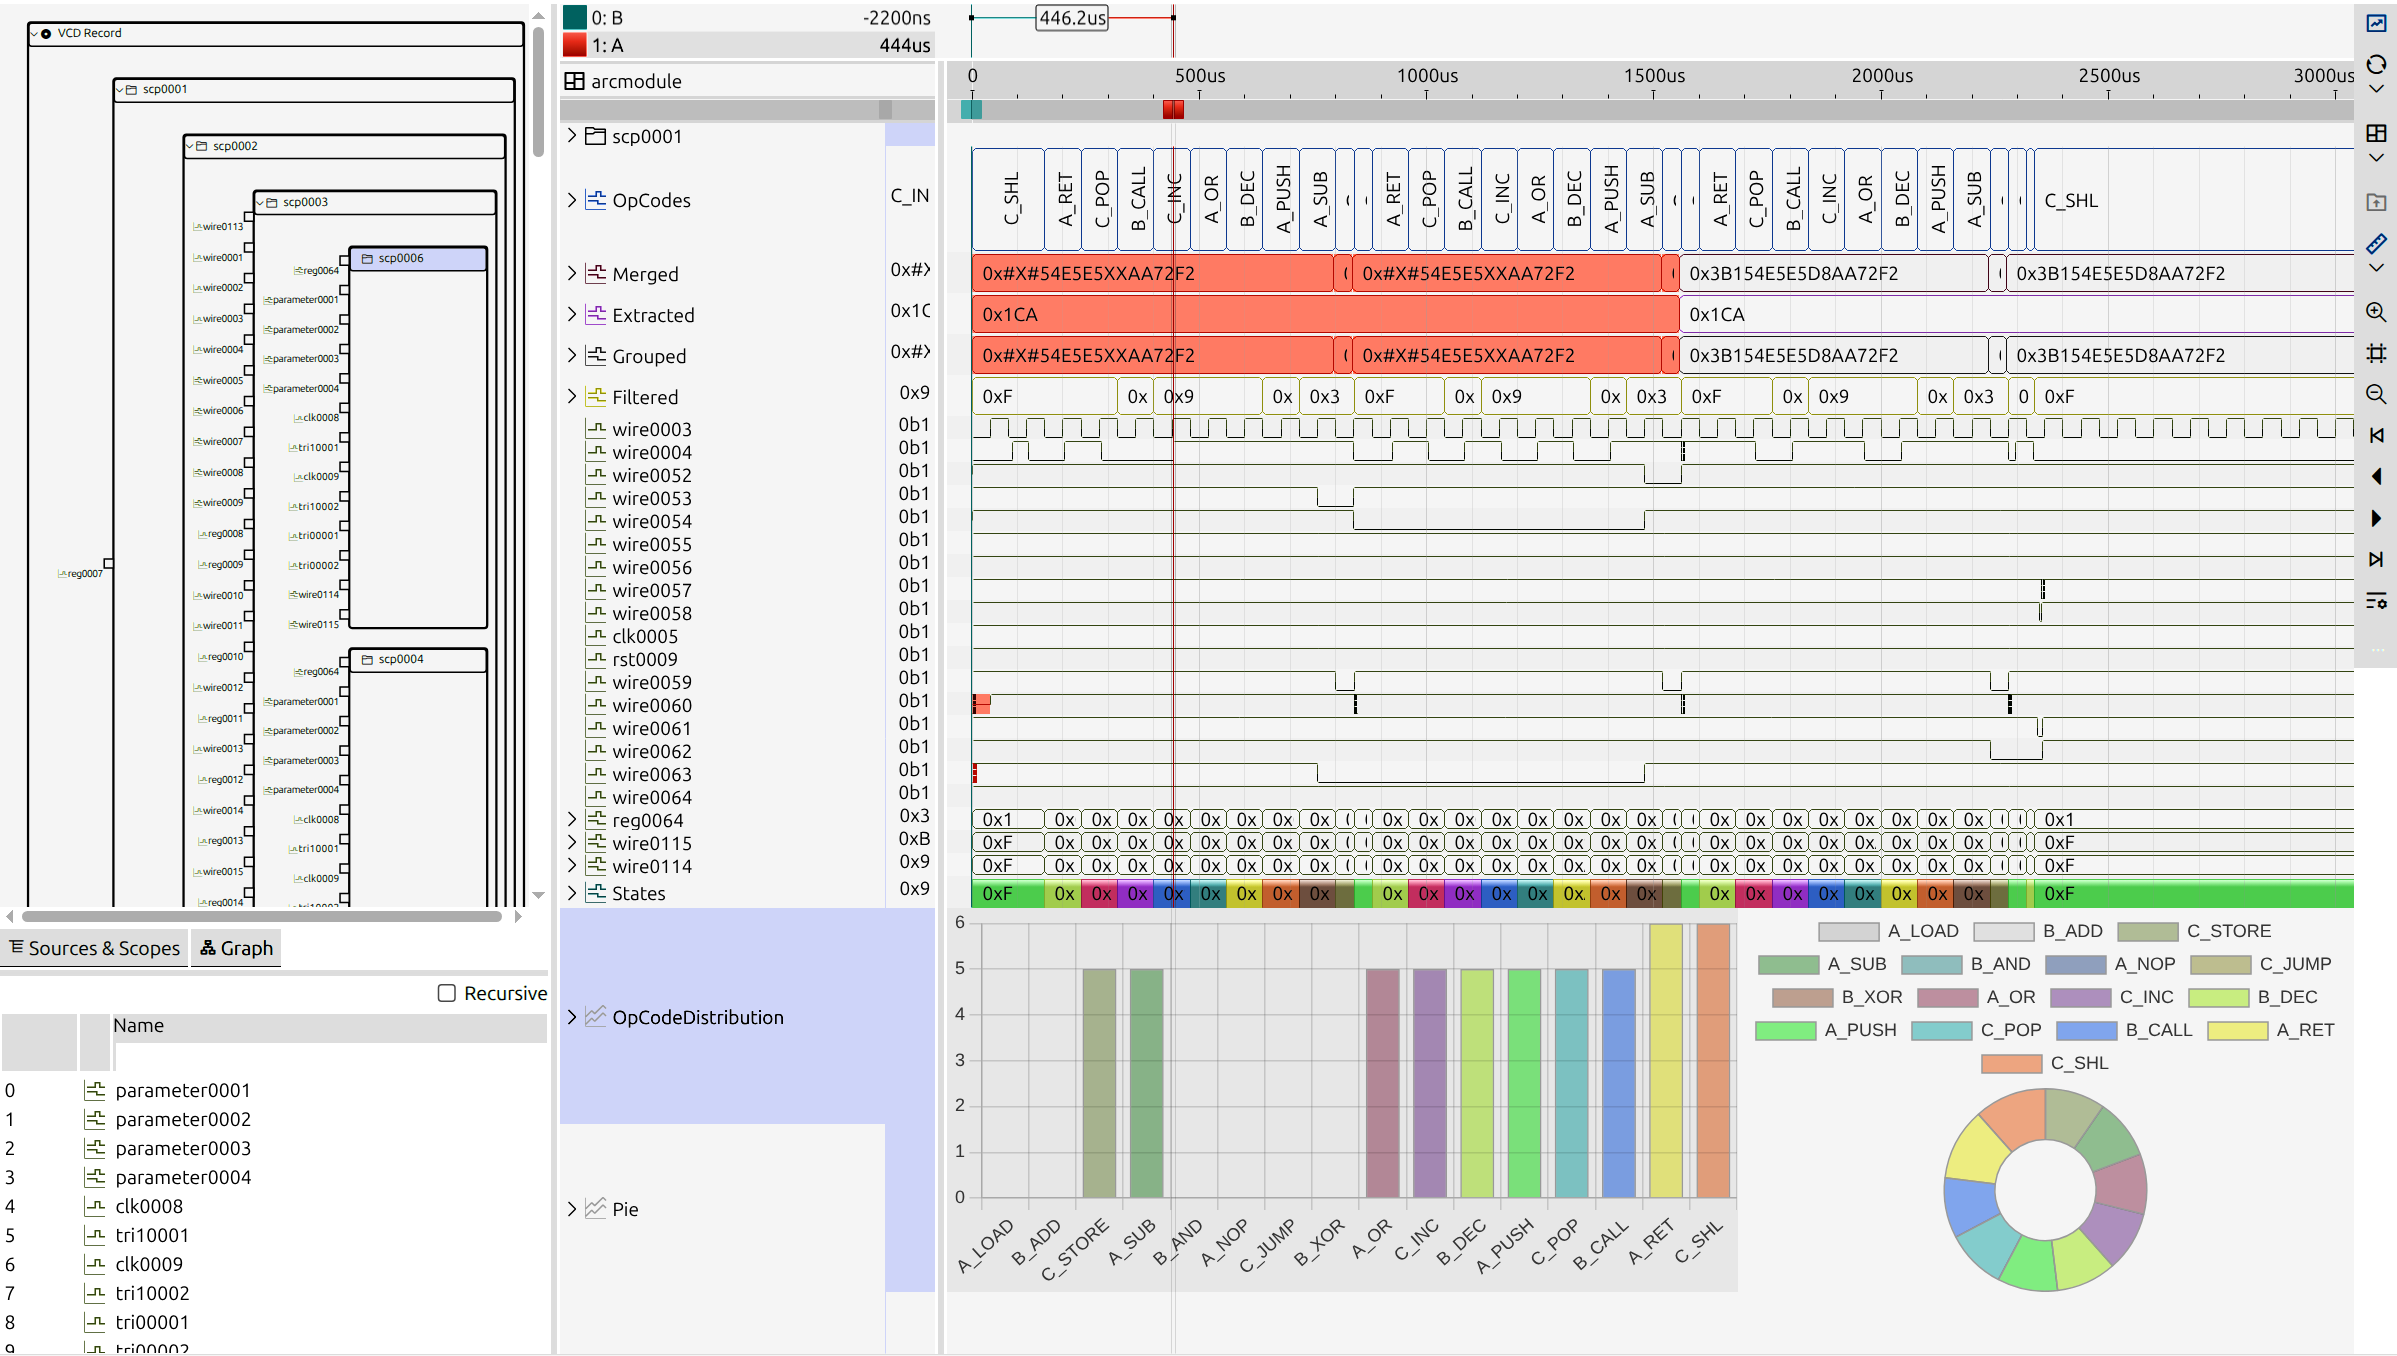
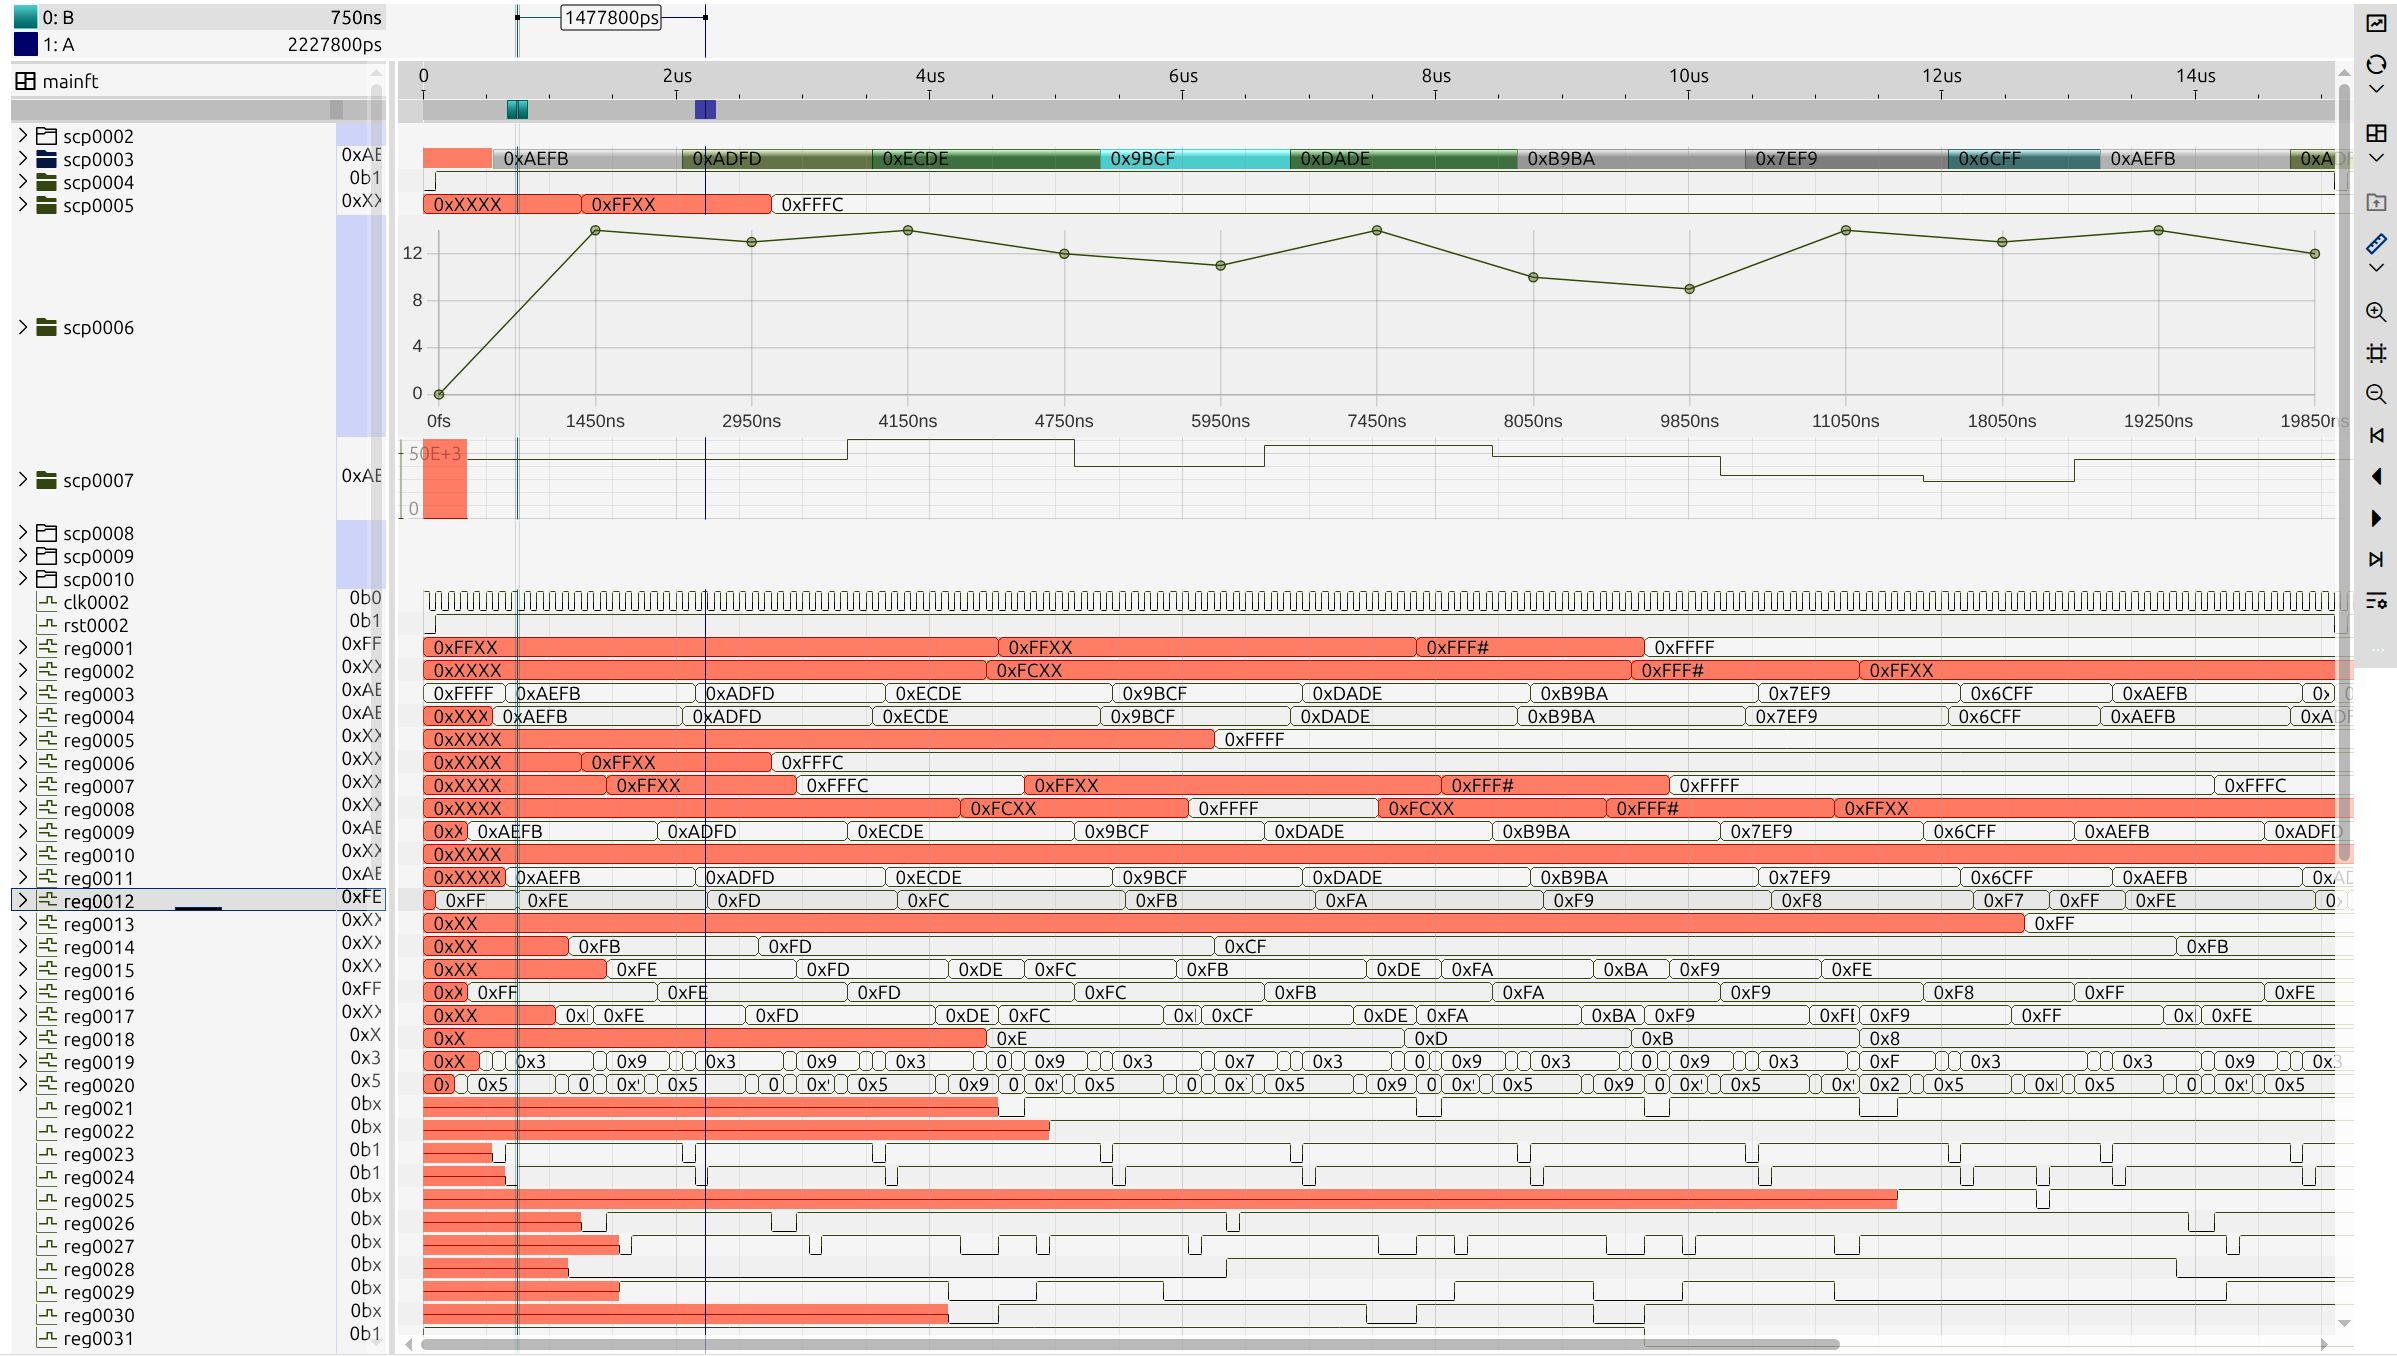
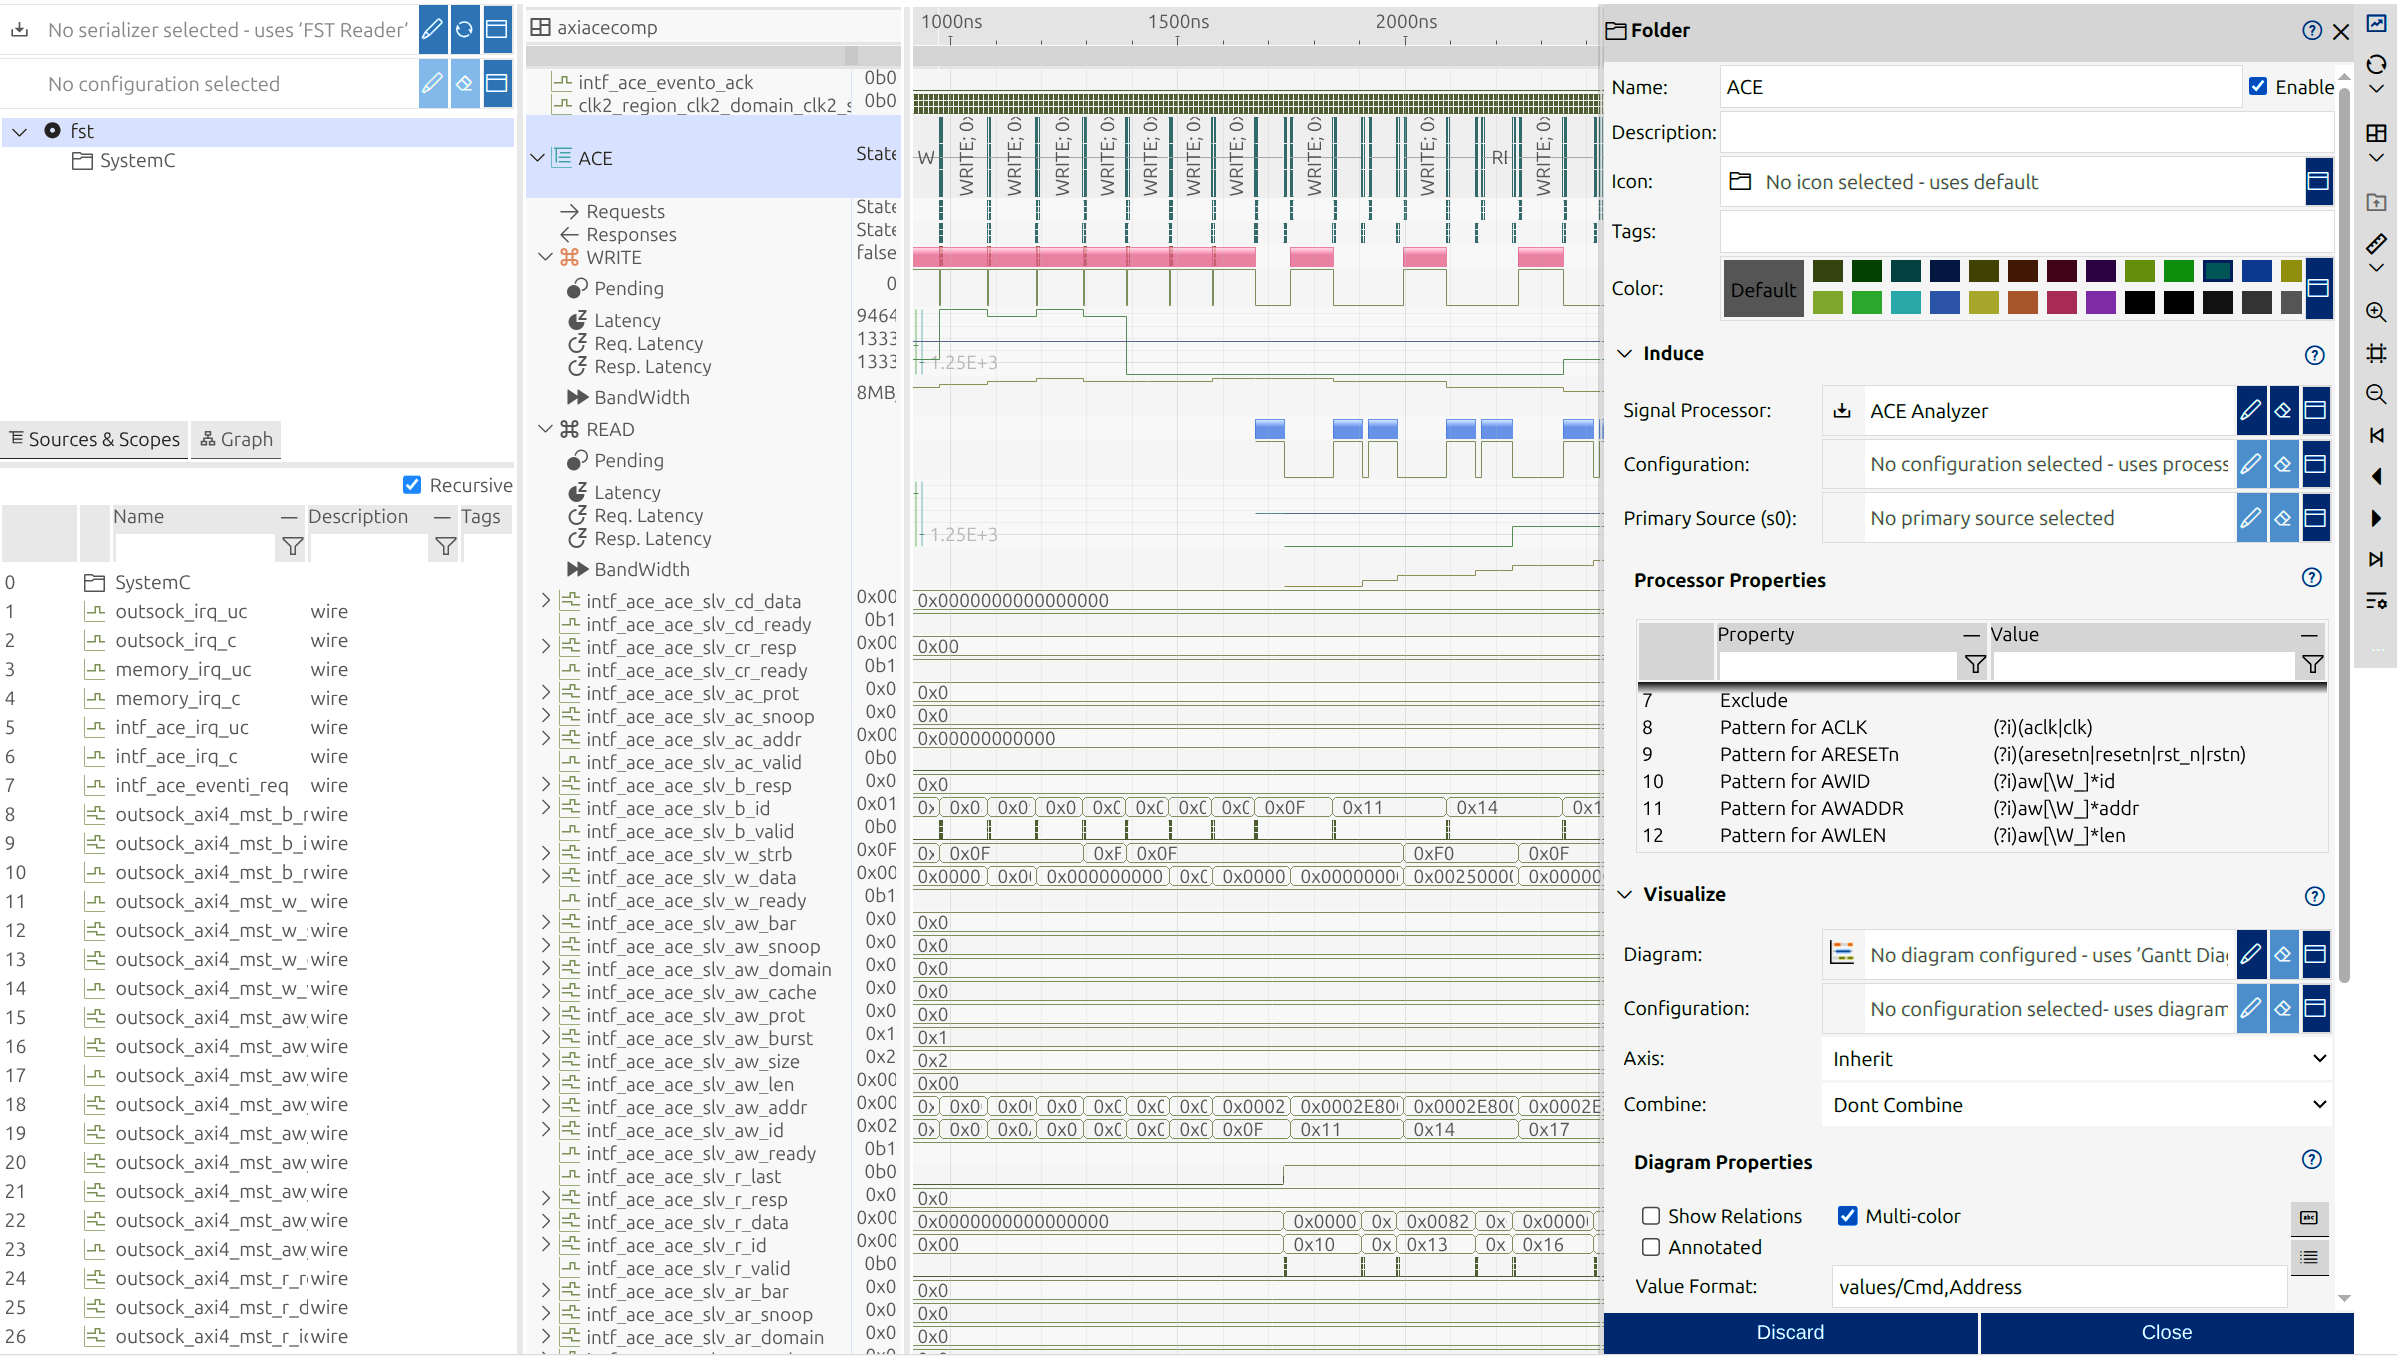
Create tailored views with multiple synchronized diagrams optimized for specific debugging tasks. Navigate design hierarchies—expand and collapse modules, apply hierarchical filters, and switch between tree and graph visualizations. Use multiple cursors to measure timing relationships across clock domains. Display signals in different value formats (binary, hex, decimal, ASCII) and diagram types (logic waveforms, analog plots, event timelines). Synchronize cursor positions and zoom levels across views to correlate events efficiently.
Process and Extract Insights
Apply mathematical operations to derive new signals—combine buses, extract protocol fields, or compute timing metrics. Implement custom protocol decoders to reconstruct transactions from pin-level activity. Search for specific signal patterns using value-based queries, regular expressions, or hierarchical path matching. Generate statistics on signal activity, transition counts, or timing violations. Automate detection of protocol violations, setup/hold violations, or glitches across multi-million cycle simulations.
Multiple Format Support
Work seamlessly with industry-standard waveform formats from major EDA vendors and open-source tools. Each reader optimizes for its format’s characteristics—text-based parsing, compressed access, or high-performance random access—ensuring efficient loading regardless of simulation tool or dataset size.
Advanced Signal Filtering
Locate signals using text fragments, regular expressions, or hierarchical path patterns. Apply numeric filters to find signals within specific value ranges at cursor positions. Filter by signal attributes such as width, type, or activity. Combine multiple filter criteria to isolate relevant signals in designs with thousands of nets.
Cross-Domain Visualization
Visualize signals across multiple domains simultaneously. Display time-domain waveforms alongside frequency-domain analysis. Create custom domain axes for voltage, current, or application-specific units. Align mixed-signal data (digital and analog) on common or independent axes depending on analysis requirements.
Hierarchical Organization
Preserve and navigate design structure exactly as defined in simulation netlists. Quickly collapse entire subsystems or expand modules of interest. Maintain context while drilling down through hierarchy levels. Use hierarchical filtering to apply patterns across module boundaries efficiently.
Value Format Flexibility
Display signal values in binary, hexadecimal, decimal, octal, ASCII, or signed/unsigned interpretations. Switch representations instantly during debugging sessions. Define custom formats for application-specific data types. Configure per-signal or per-view format preferences for optimal readability.
Synchronized Multi-View Analysis
Create multiple independent views of the same waveform data. Optimize each view for different debugging tasks—one for timing analysis, another for functional verification. Synchronize cursor positions and zoom levels across views. Efficiently correlate events by setting markers in one view and observing effects in others.
Real-Time Streaming
Analyze simulation results while they’re being generated. Monitor long-running simulations without waiting for completion. Update waveforms continuously as new data arrives. Set breakpoints or conditional stops based on signal patterns detected during streaming.
Customizable Diagrams
Virtual Prototyping with SystemC and TLM
Accelerating System-Level Debugging
Virtual prototyping is essential for debugging system architectures and software integration before hardware is available. SystemC and Transaction-Level Modeling (TLM) provide high-level models that expose system interactions and timing, but their event-driven nature and abstraction can challenge traditional debugging methods. impulse bridges this gap by supporting SystemC and TLM workflows. Engineers can trace transaction lifecycles, correlate software and hardware events, and extract performance metrics from virtual prototypes. Whether investigating cache coherency or analyzing memory subsystem behavior, impulse enables efficient system-level debugging with advanced visualization and analysis tools.
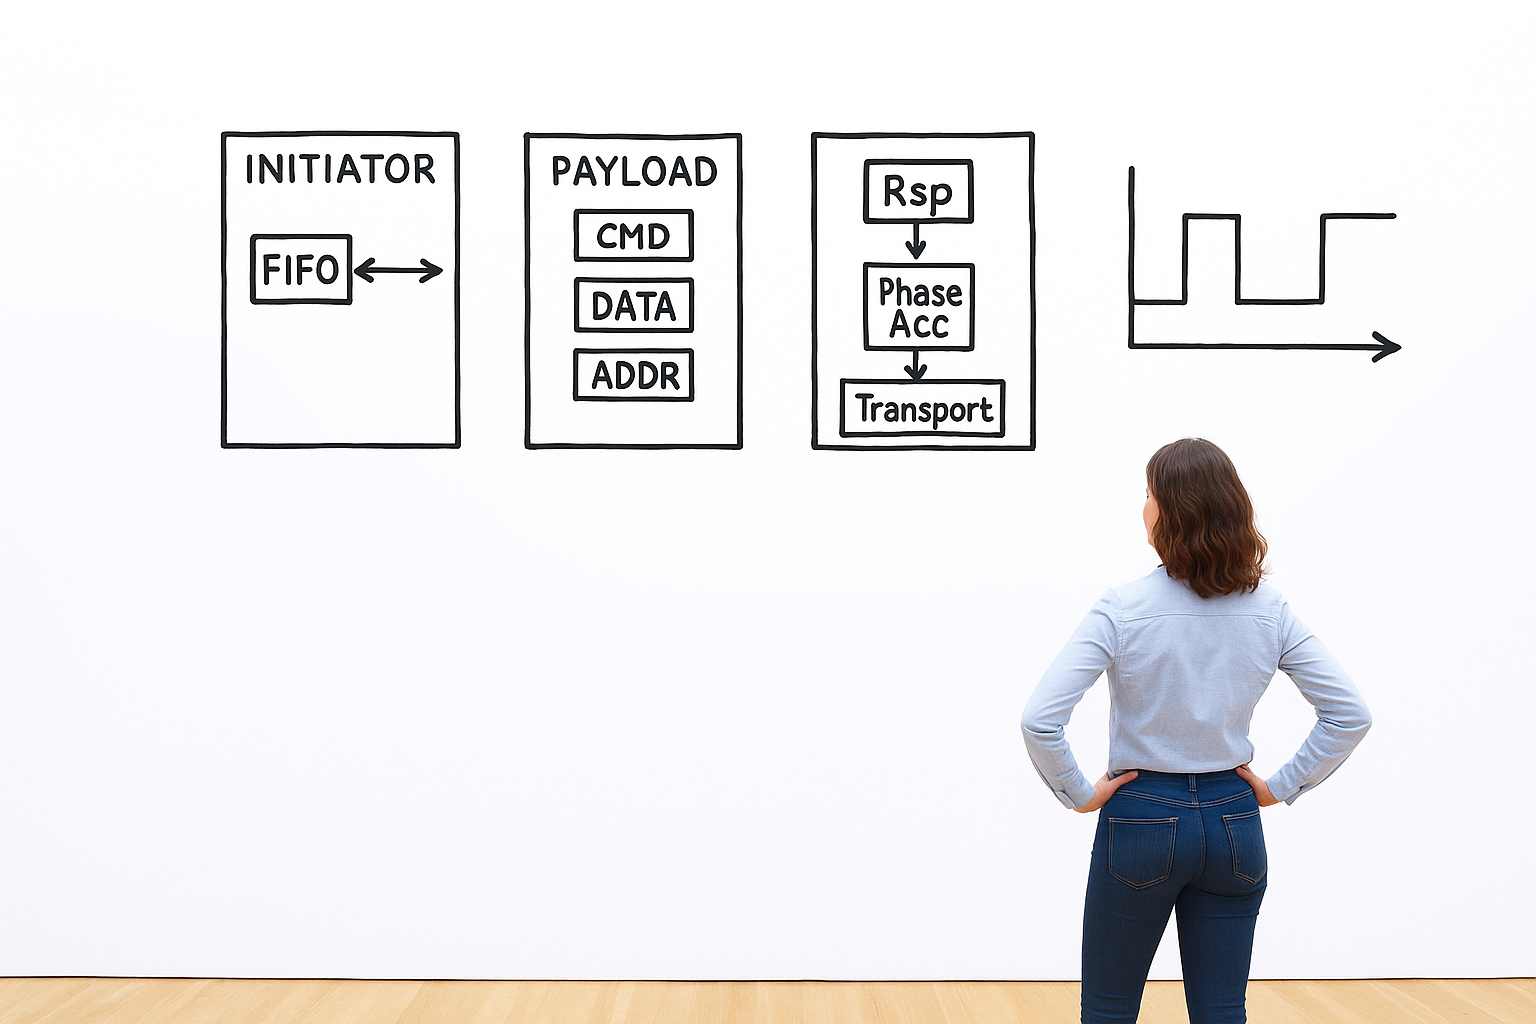
Load and Combine SystemC and TLM Data
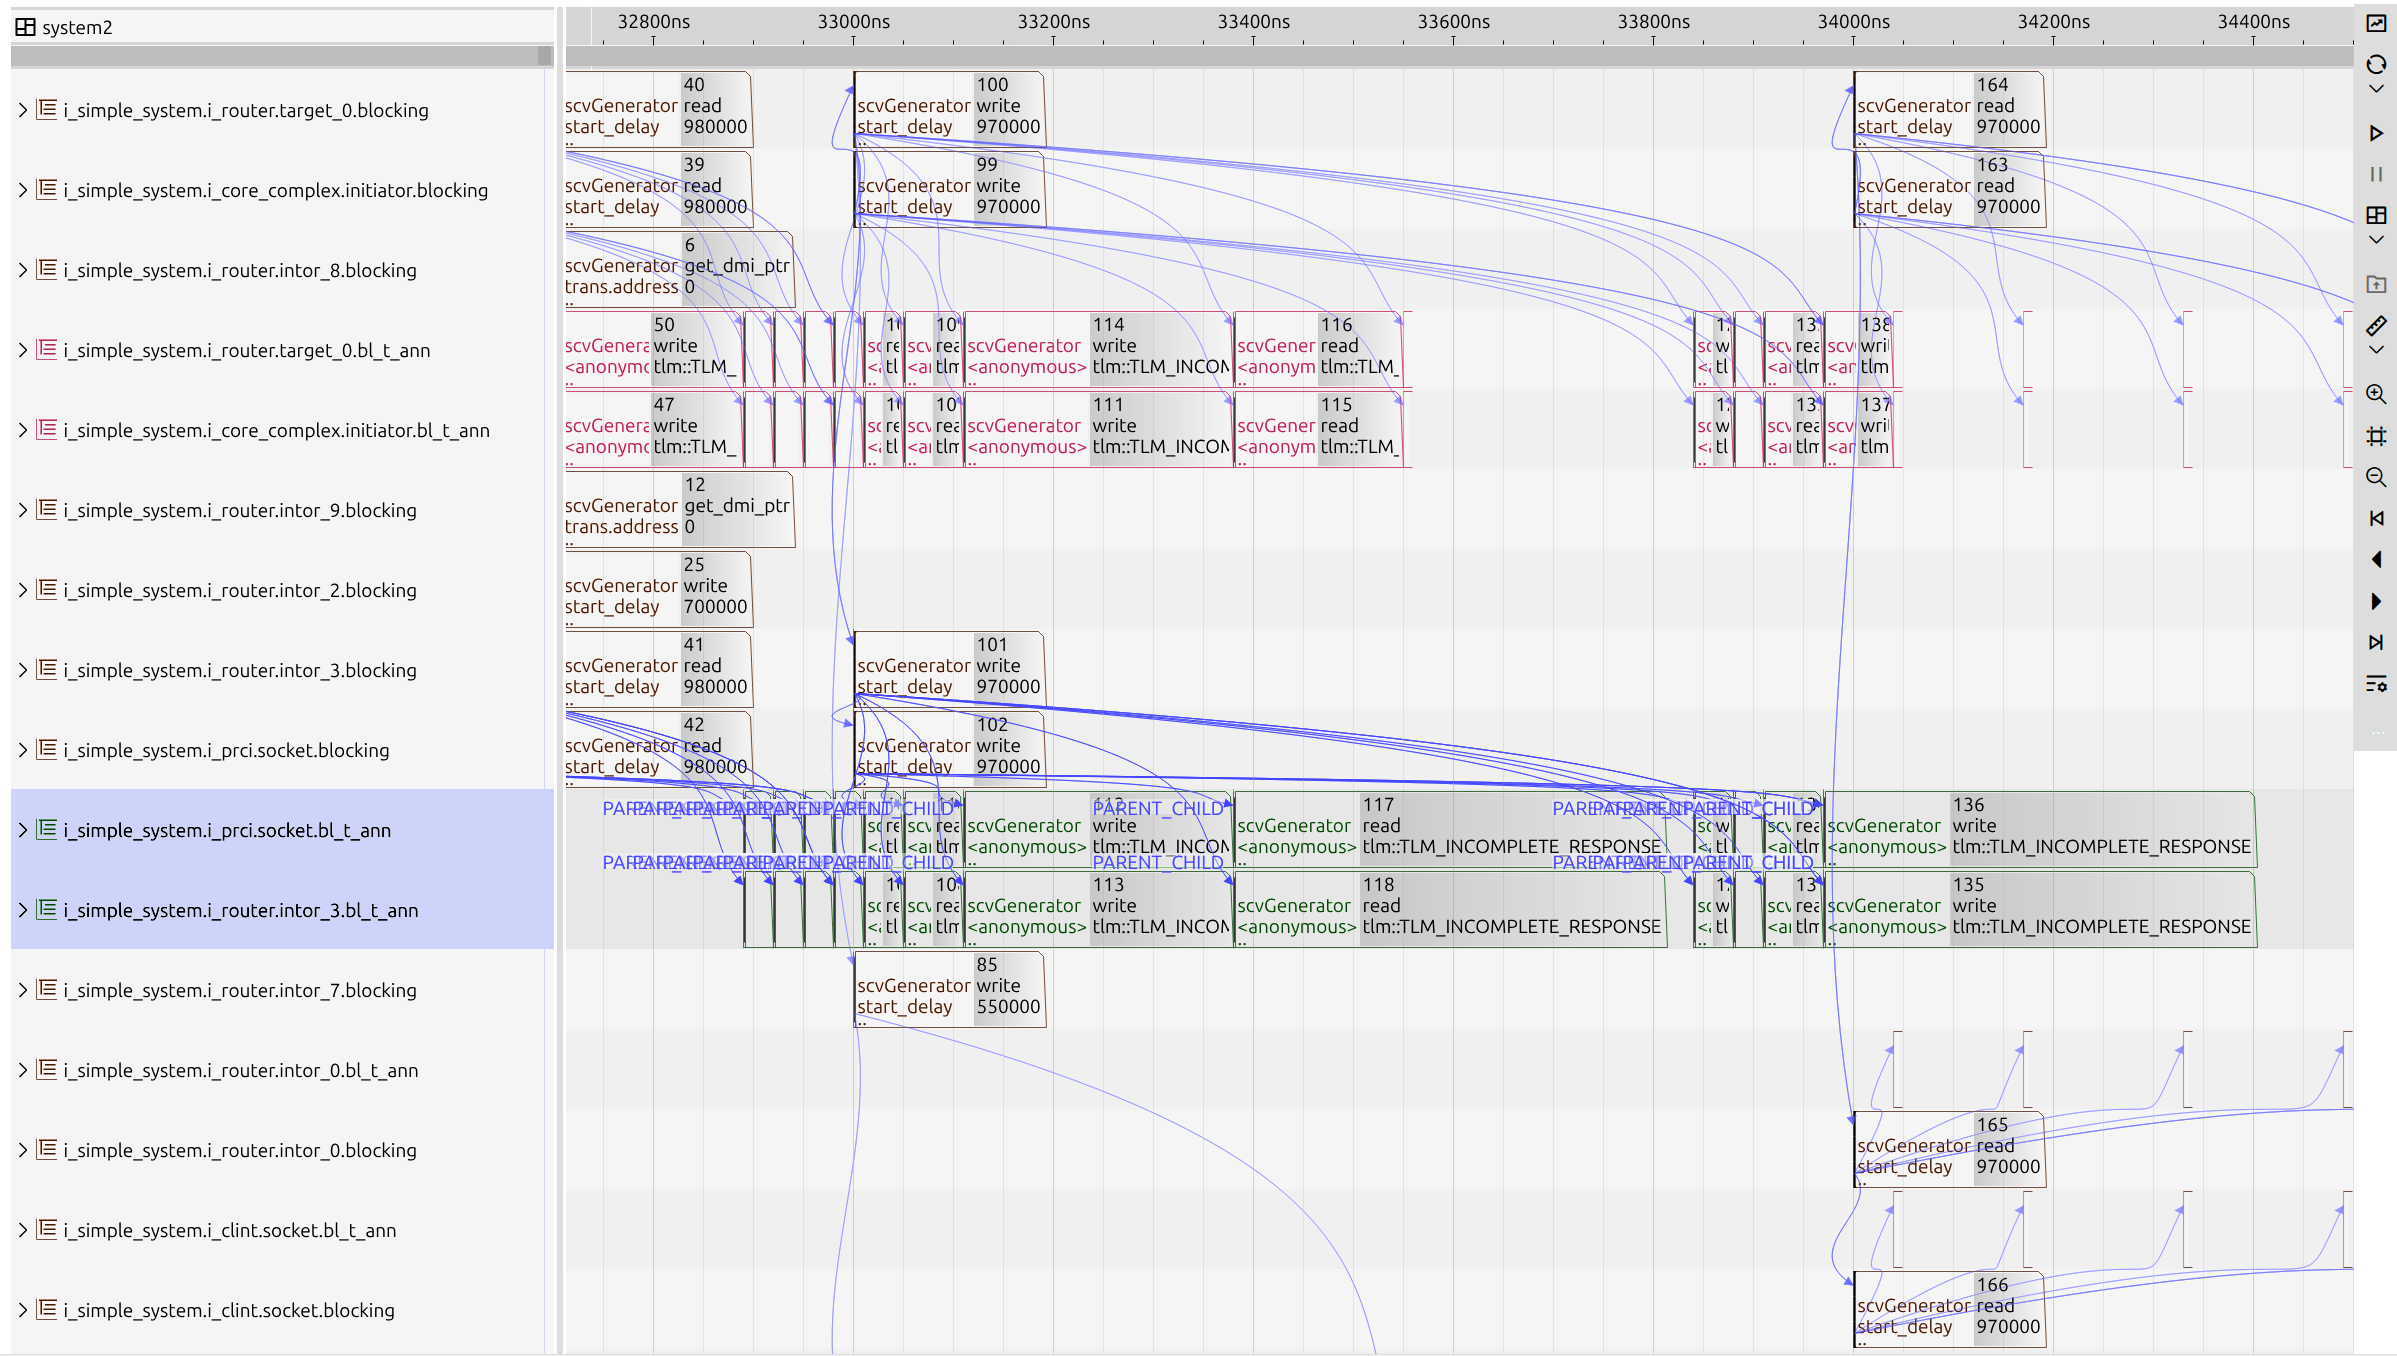
Combine data from multiple heterogeneous sources—merge SystemC VCD traces with TLM transaction logs, synchronize analog waveforms with digital signals, integrate tabular performance data with simulation outputs, or correlate software logs with hardware traces. SystemC module hierarchies, ports, and channels are preserved, enabling navigation through virtual prototype structures across diverse data formats and abstraction levels. Explore hierarchical module organization, expand and collapse component instances, and trace communication paths through interconnect models to locate specific transactions or signals.
Trace and Correlate Transactions
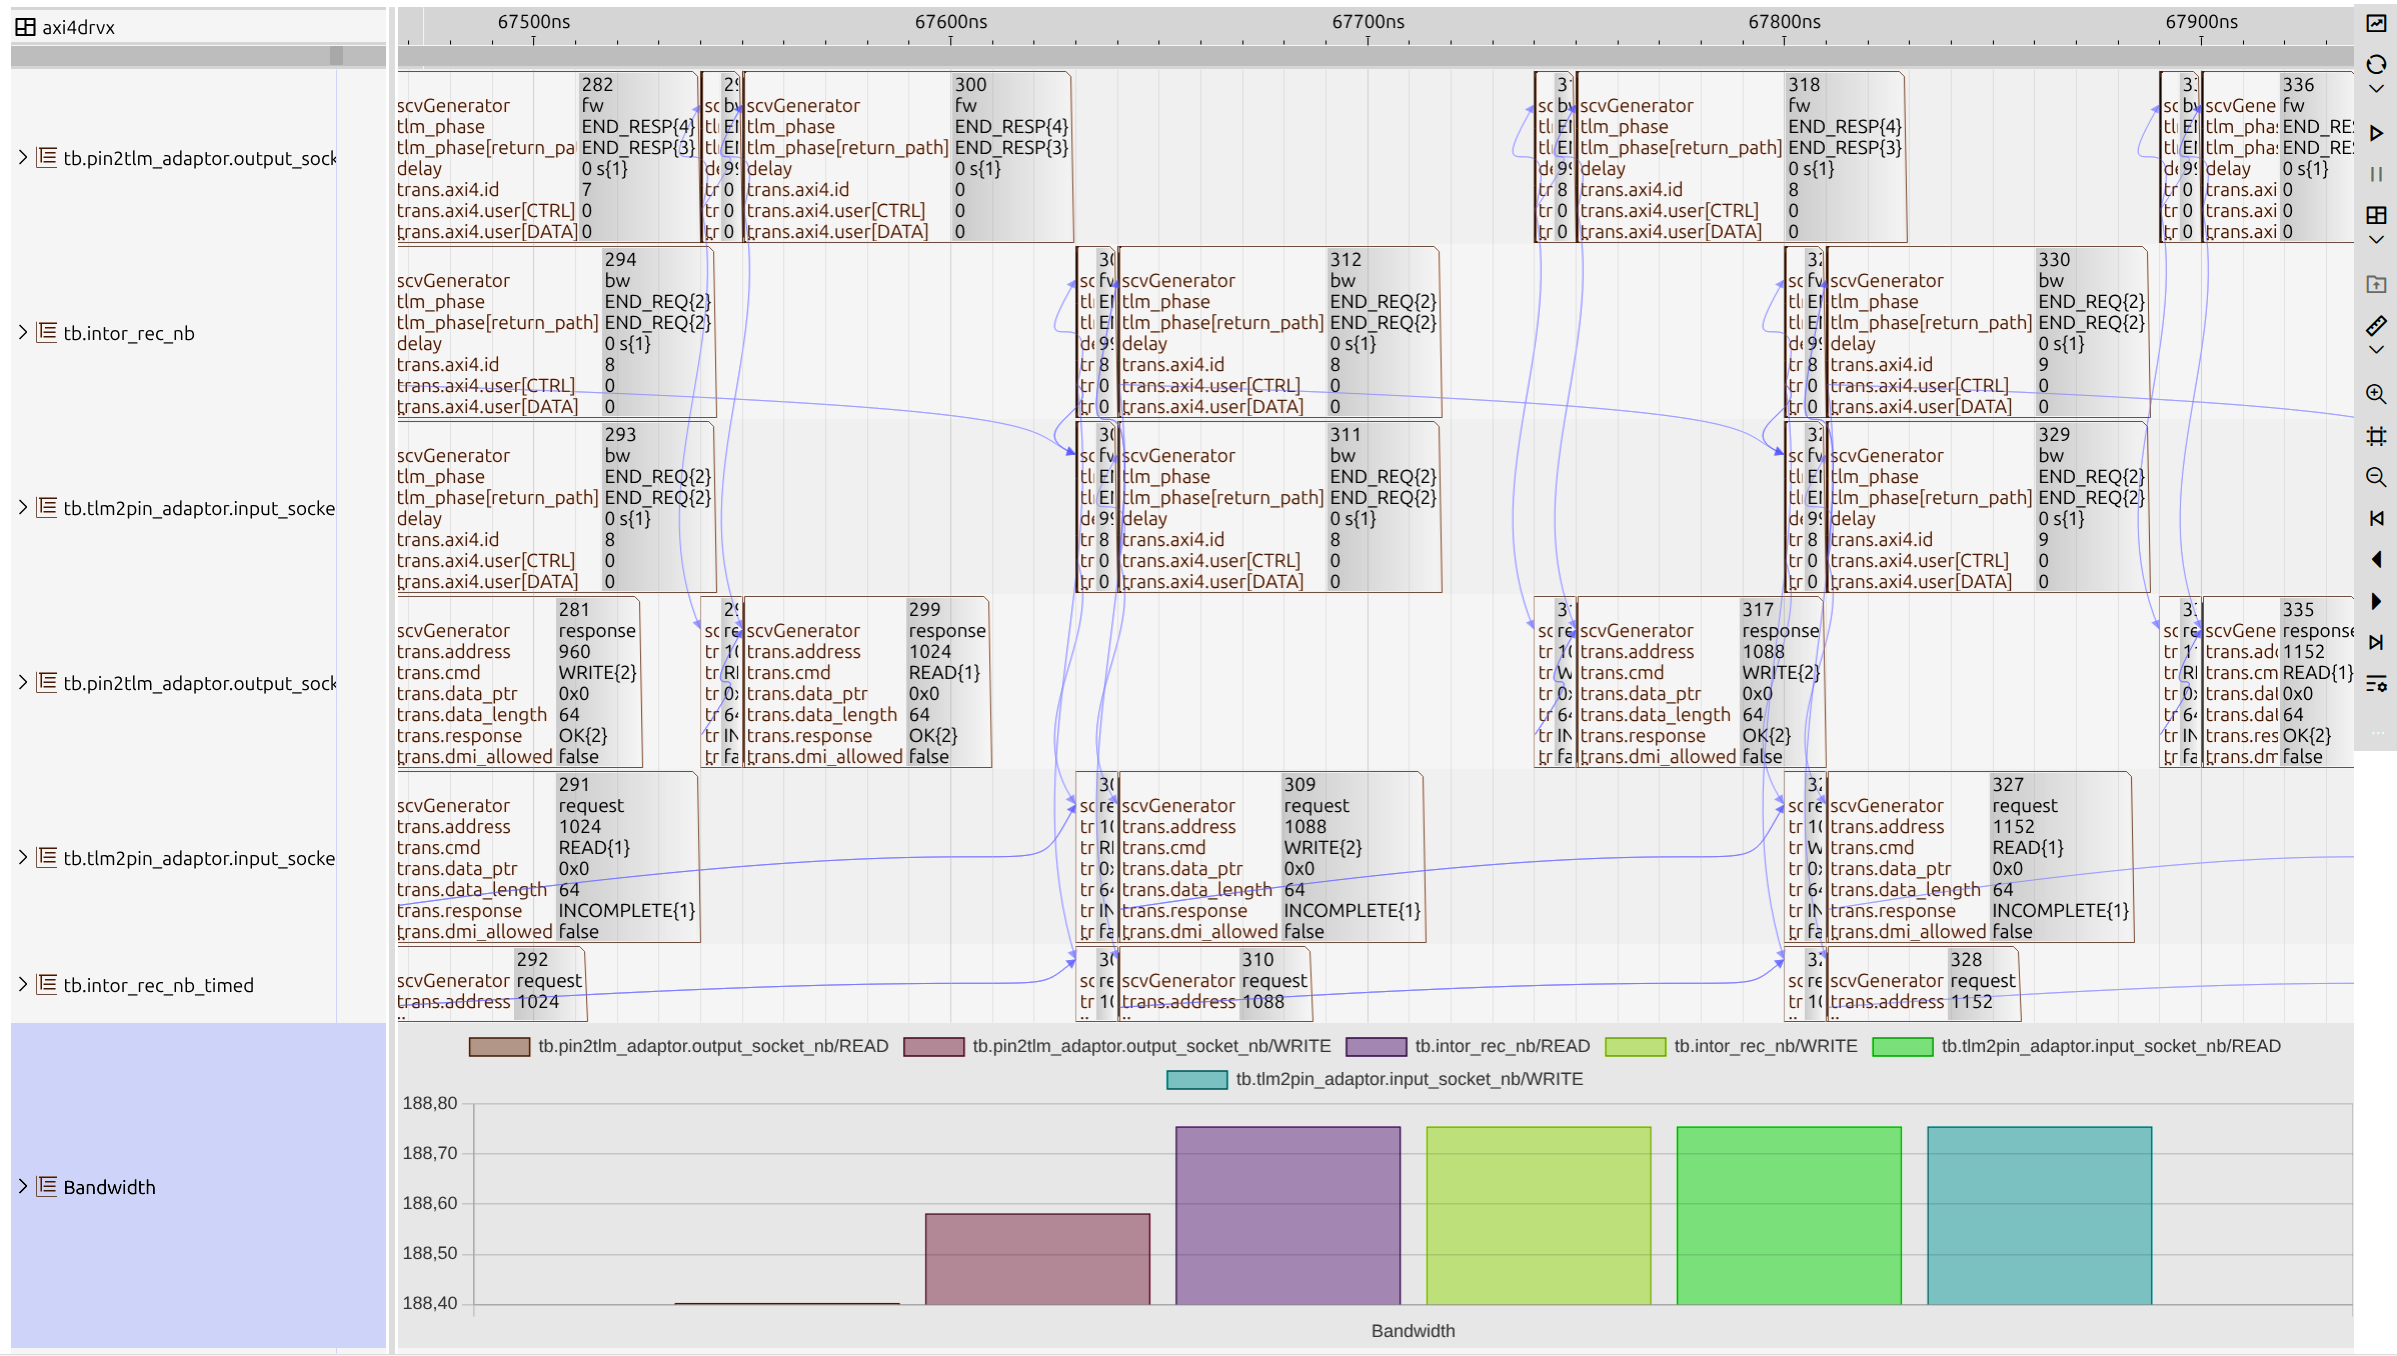
Follow individual TLM transactions from initiation through completion with automatic phase correlation (BEGIN_REQ, END_REQ, BEGIN_RESP, END_RESP). Track transactions across temporal decoupling boundaries and handle out-of-order completions. Combine software execution traces with TLM transaction data—align CPU instruction execution with memory access transactions, interrupt events with peripheral communications, and OS scheduler activity with hardware resource utilization.
Analyze Performance and Behavior
Extract bandwidth, latency, and throughput statistics directly from TLM communications. Generate performance metrics including transaction latencies (min/max/average), bandwidth utilization per channel, and resource contention statistics. Monitor long-running virtual prototype simulations in real-time, updating transaction views as simulations progress. Set conditional breakpoints based on transaction patterns or performance thresholds.
SystemC Signal Support
Analyze both digital and Analog Mixed-Signal (AMS) SystemC simulations. impulse handles continuous-time analog signals alongside discrete digital events, providing complete visibility into mixed-signal system behavior. Navigate hierarchical module structures, inspect port connections, and trace signal propagation through SystemC channels.
TLM-2.0 Phase Correlation
Automatically correlate all phases of TLM-2.0 communications. Track BEGIN_REQ through END_RESP sequences, handling out-of-order completions and overlapping transactions. Visualize phase relationships on timeline views to understand protocol timing and identify handshake violations.
Protocol Analysis
Transaction Attribute Inspection
Performance Profiling
Generic Payload Support
Handle TLM-2.0 generic payloads and protocol-specific extensions. Decode custom attributes added by specialized protocols. Visualize payload fields in human-readable formats tailored to your virtual prototype’s communication mechanisms.
Transaction-Level Analysis
Beyond Pin-Level Signals
Modern SoC designs communicate using sophisticated protocols—industry-standard interconnects and proprietary buses. Understanding system behavior at the protocol level, rather than individual pin transitions, is essential for efficient debugging and analysis. Traditional waveform viewers require manual correlation of handshakes, tracking of transaction IDs, and interpretation of multi-channel interactions, consuming valuable debugging time. impulse automates transaction-level analysis by reconstructing high-level protocol operations from low-level pin activity. Engineers can visualize complete transactions with all attributes, correlate activity across parallel channels, and handle out-of-order completions automatically. Whether debugging cache coherency violations in multi-core systems, analyzing burst efficiency, or investigating link-layer retransmissions, impulse provides protocol-aware views that accelerate root cause analysis. Advanced features support protocol-specific mechanisms like QoS priority escalation, atomic operations, and snoop-based coherency, enabling deep insights into interconnect behavior and performance characteristics.
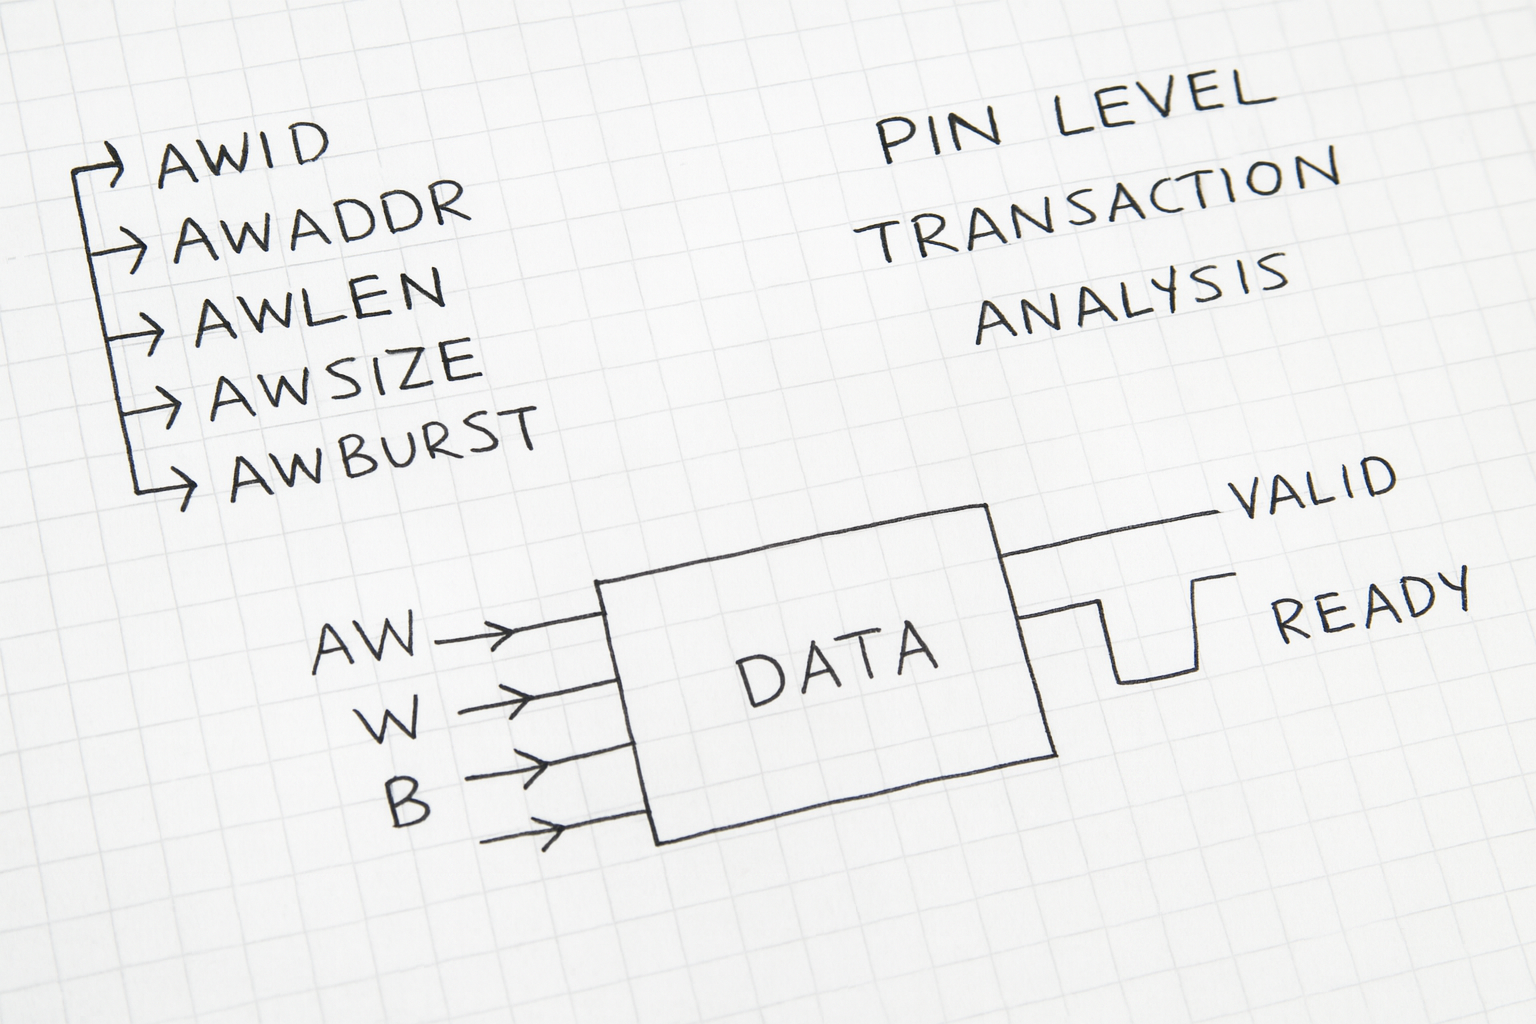
Reconstruct Transactions from Pin-Level Signals
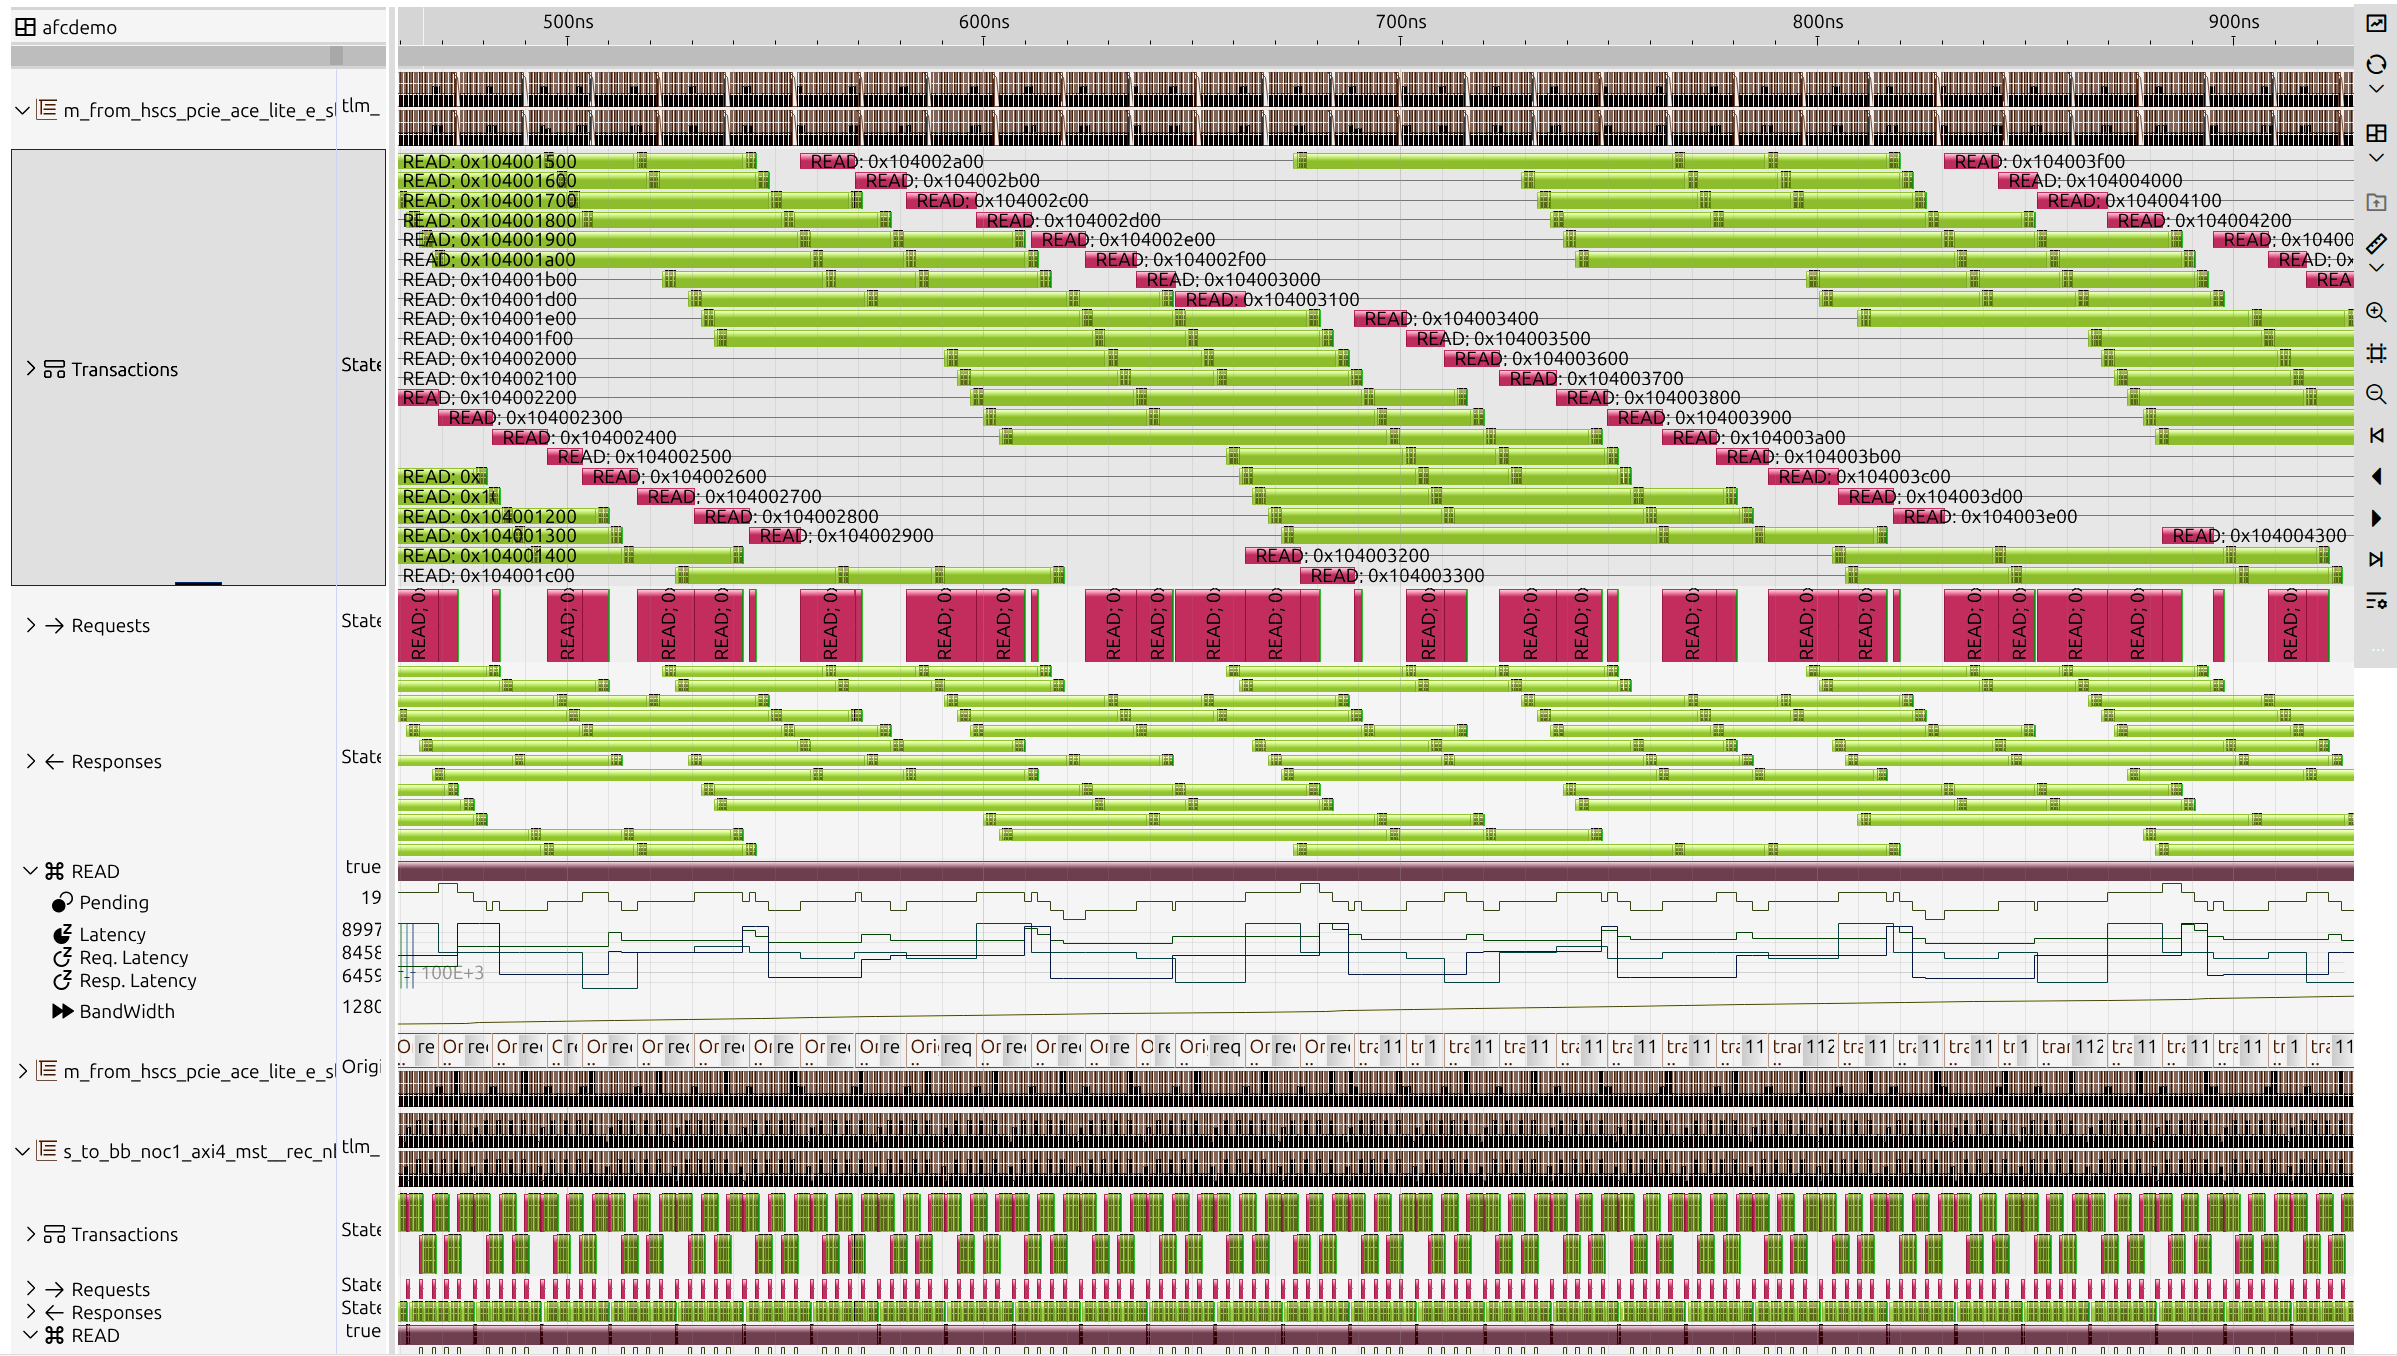
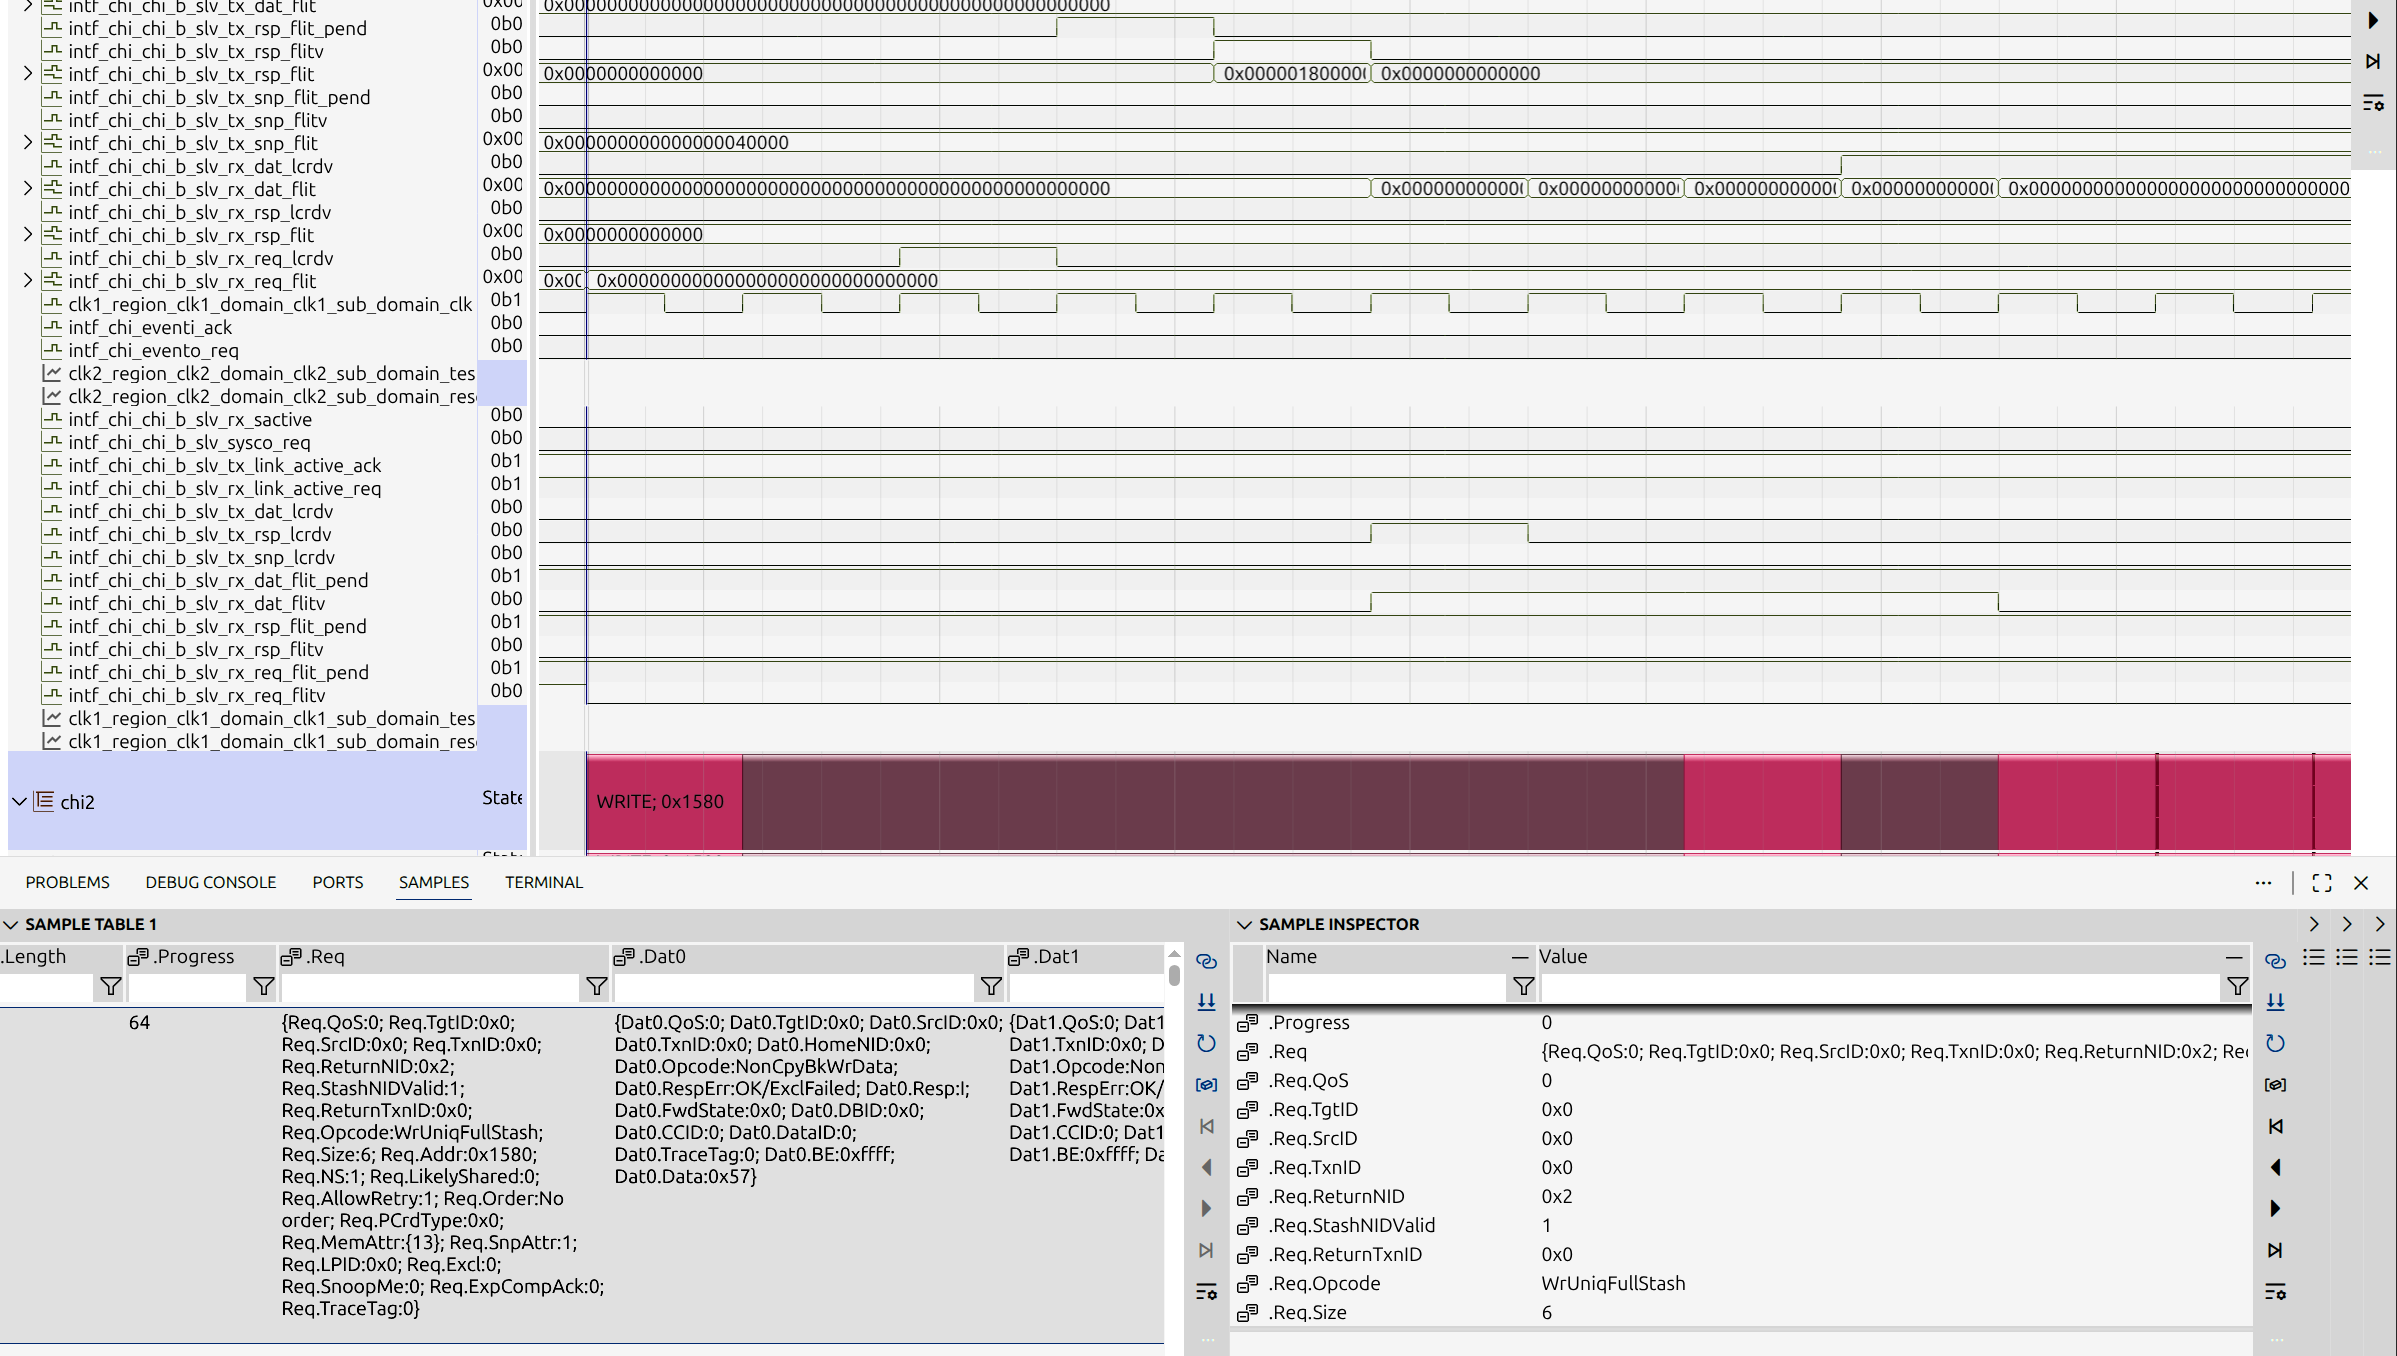
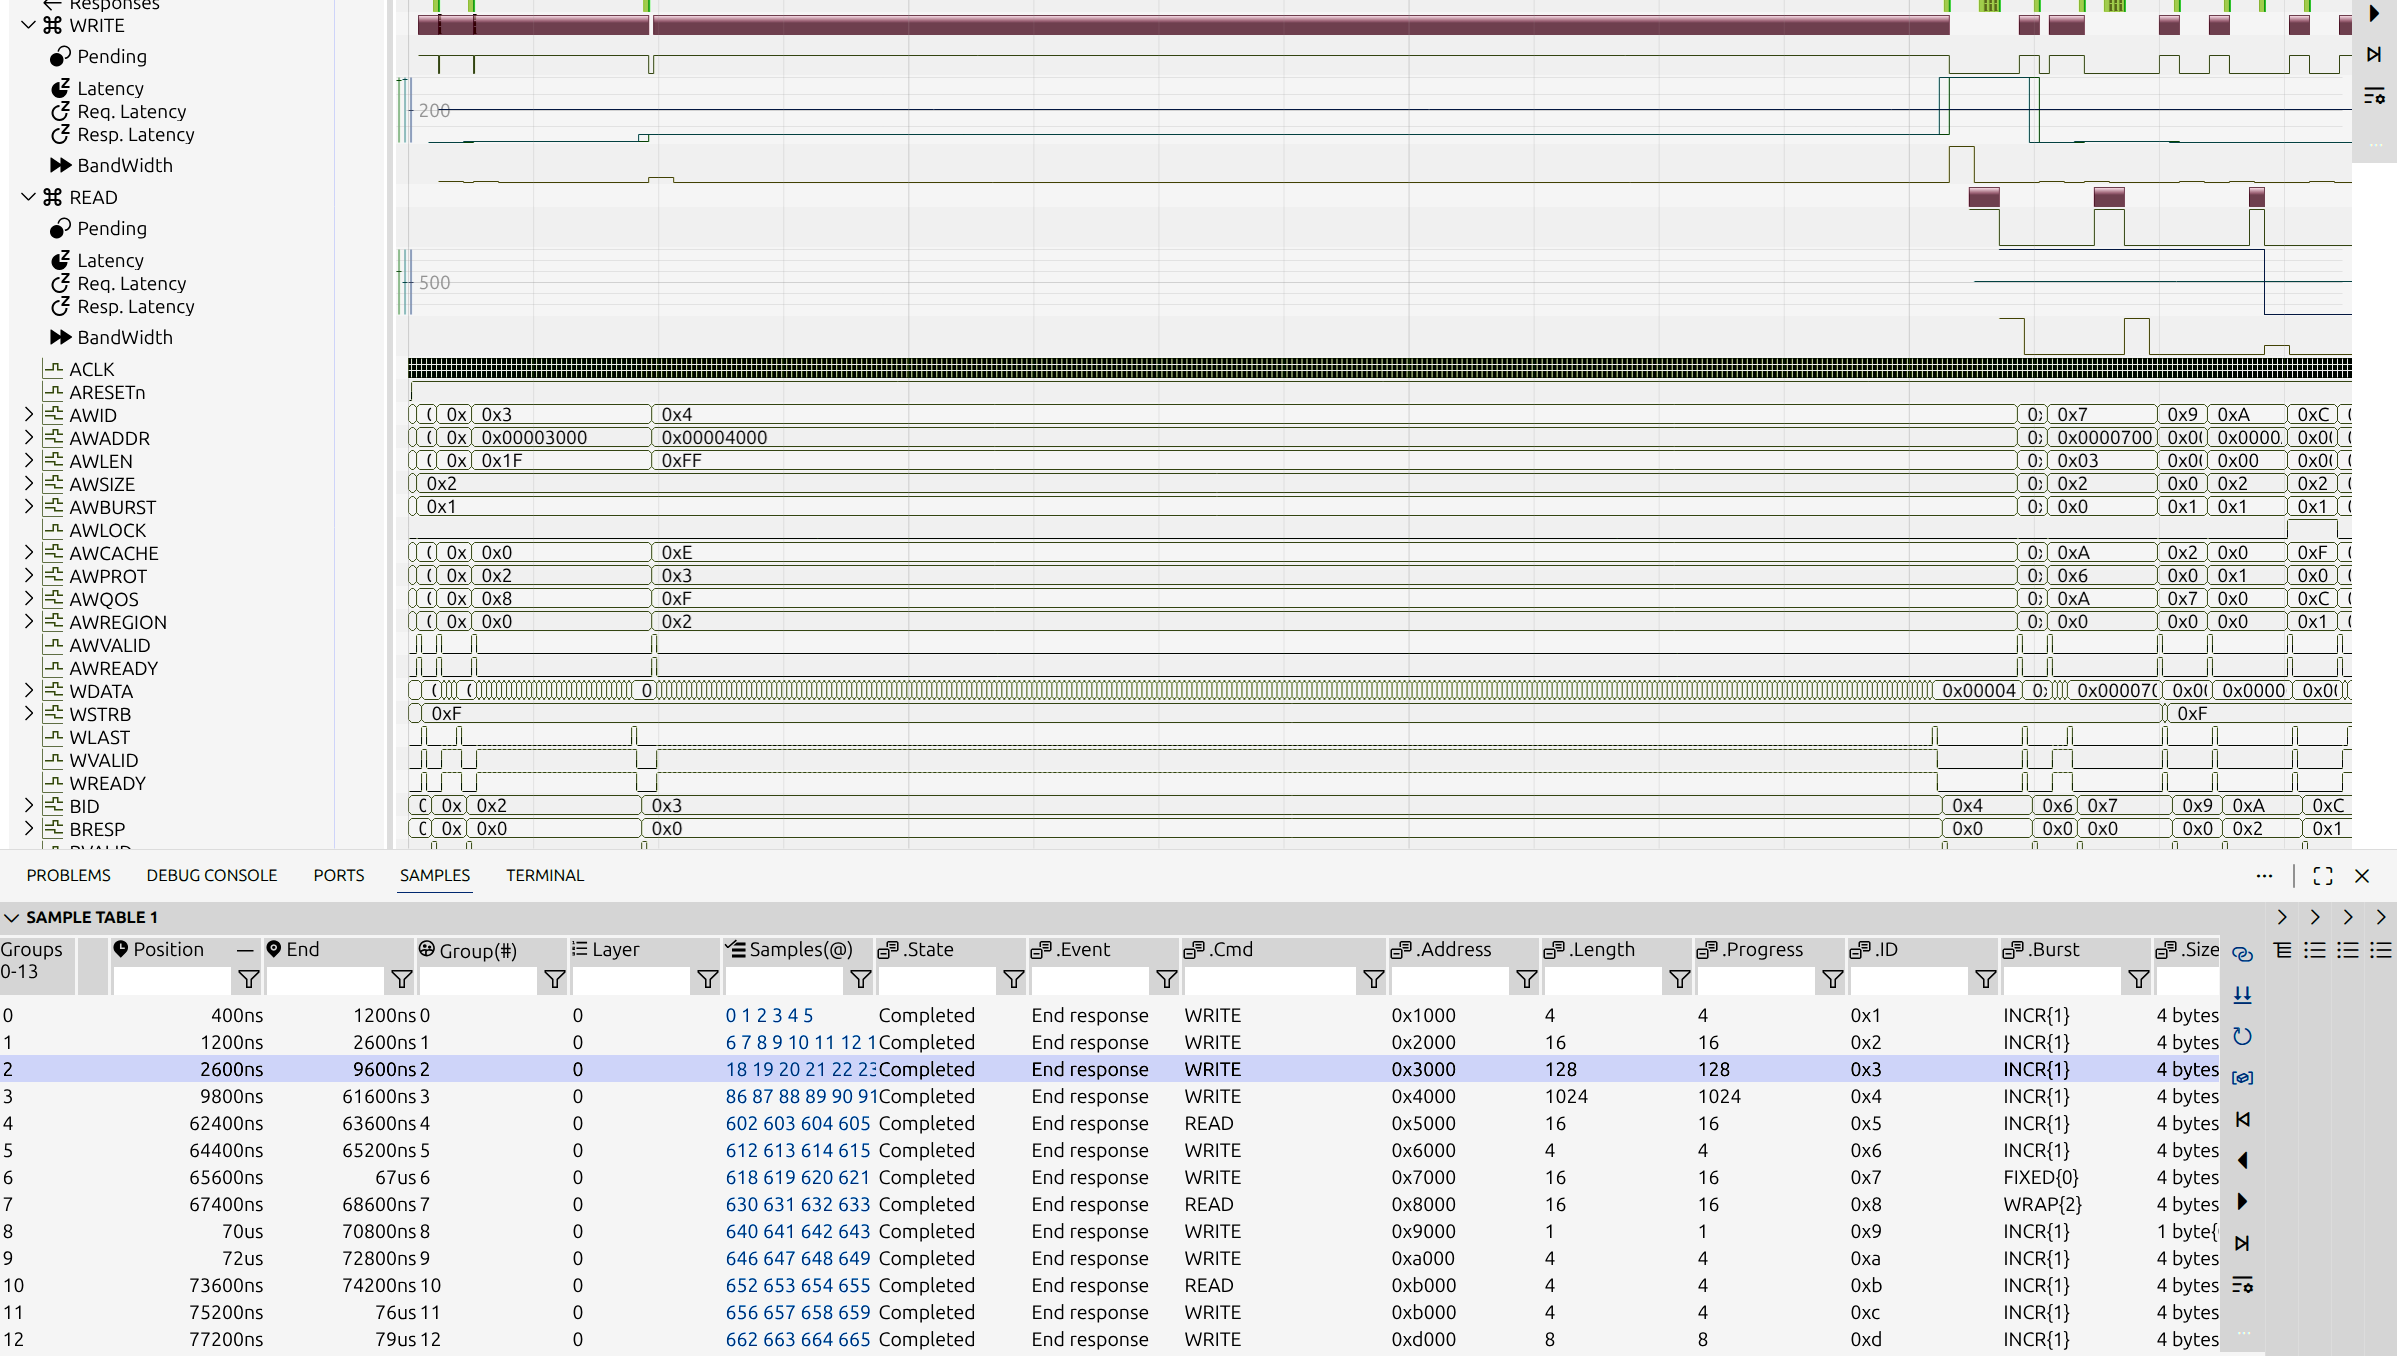
Automatically extract high-level protocol transactions from waveform data. Import pin-level signals and let impulse reconstruct complete operations—reads, writes, coherency operations, or custom protocols. Instead of manually correlating handshake signals and tracking transaction IDs, see unified views with all attributes (addresses, data, IDs, QoS). Handle multi-channel protocols automatically, correlating request, response, data, and snoop channels into coherent transaction sequences.
Visualize Transaction Flows and Relationships
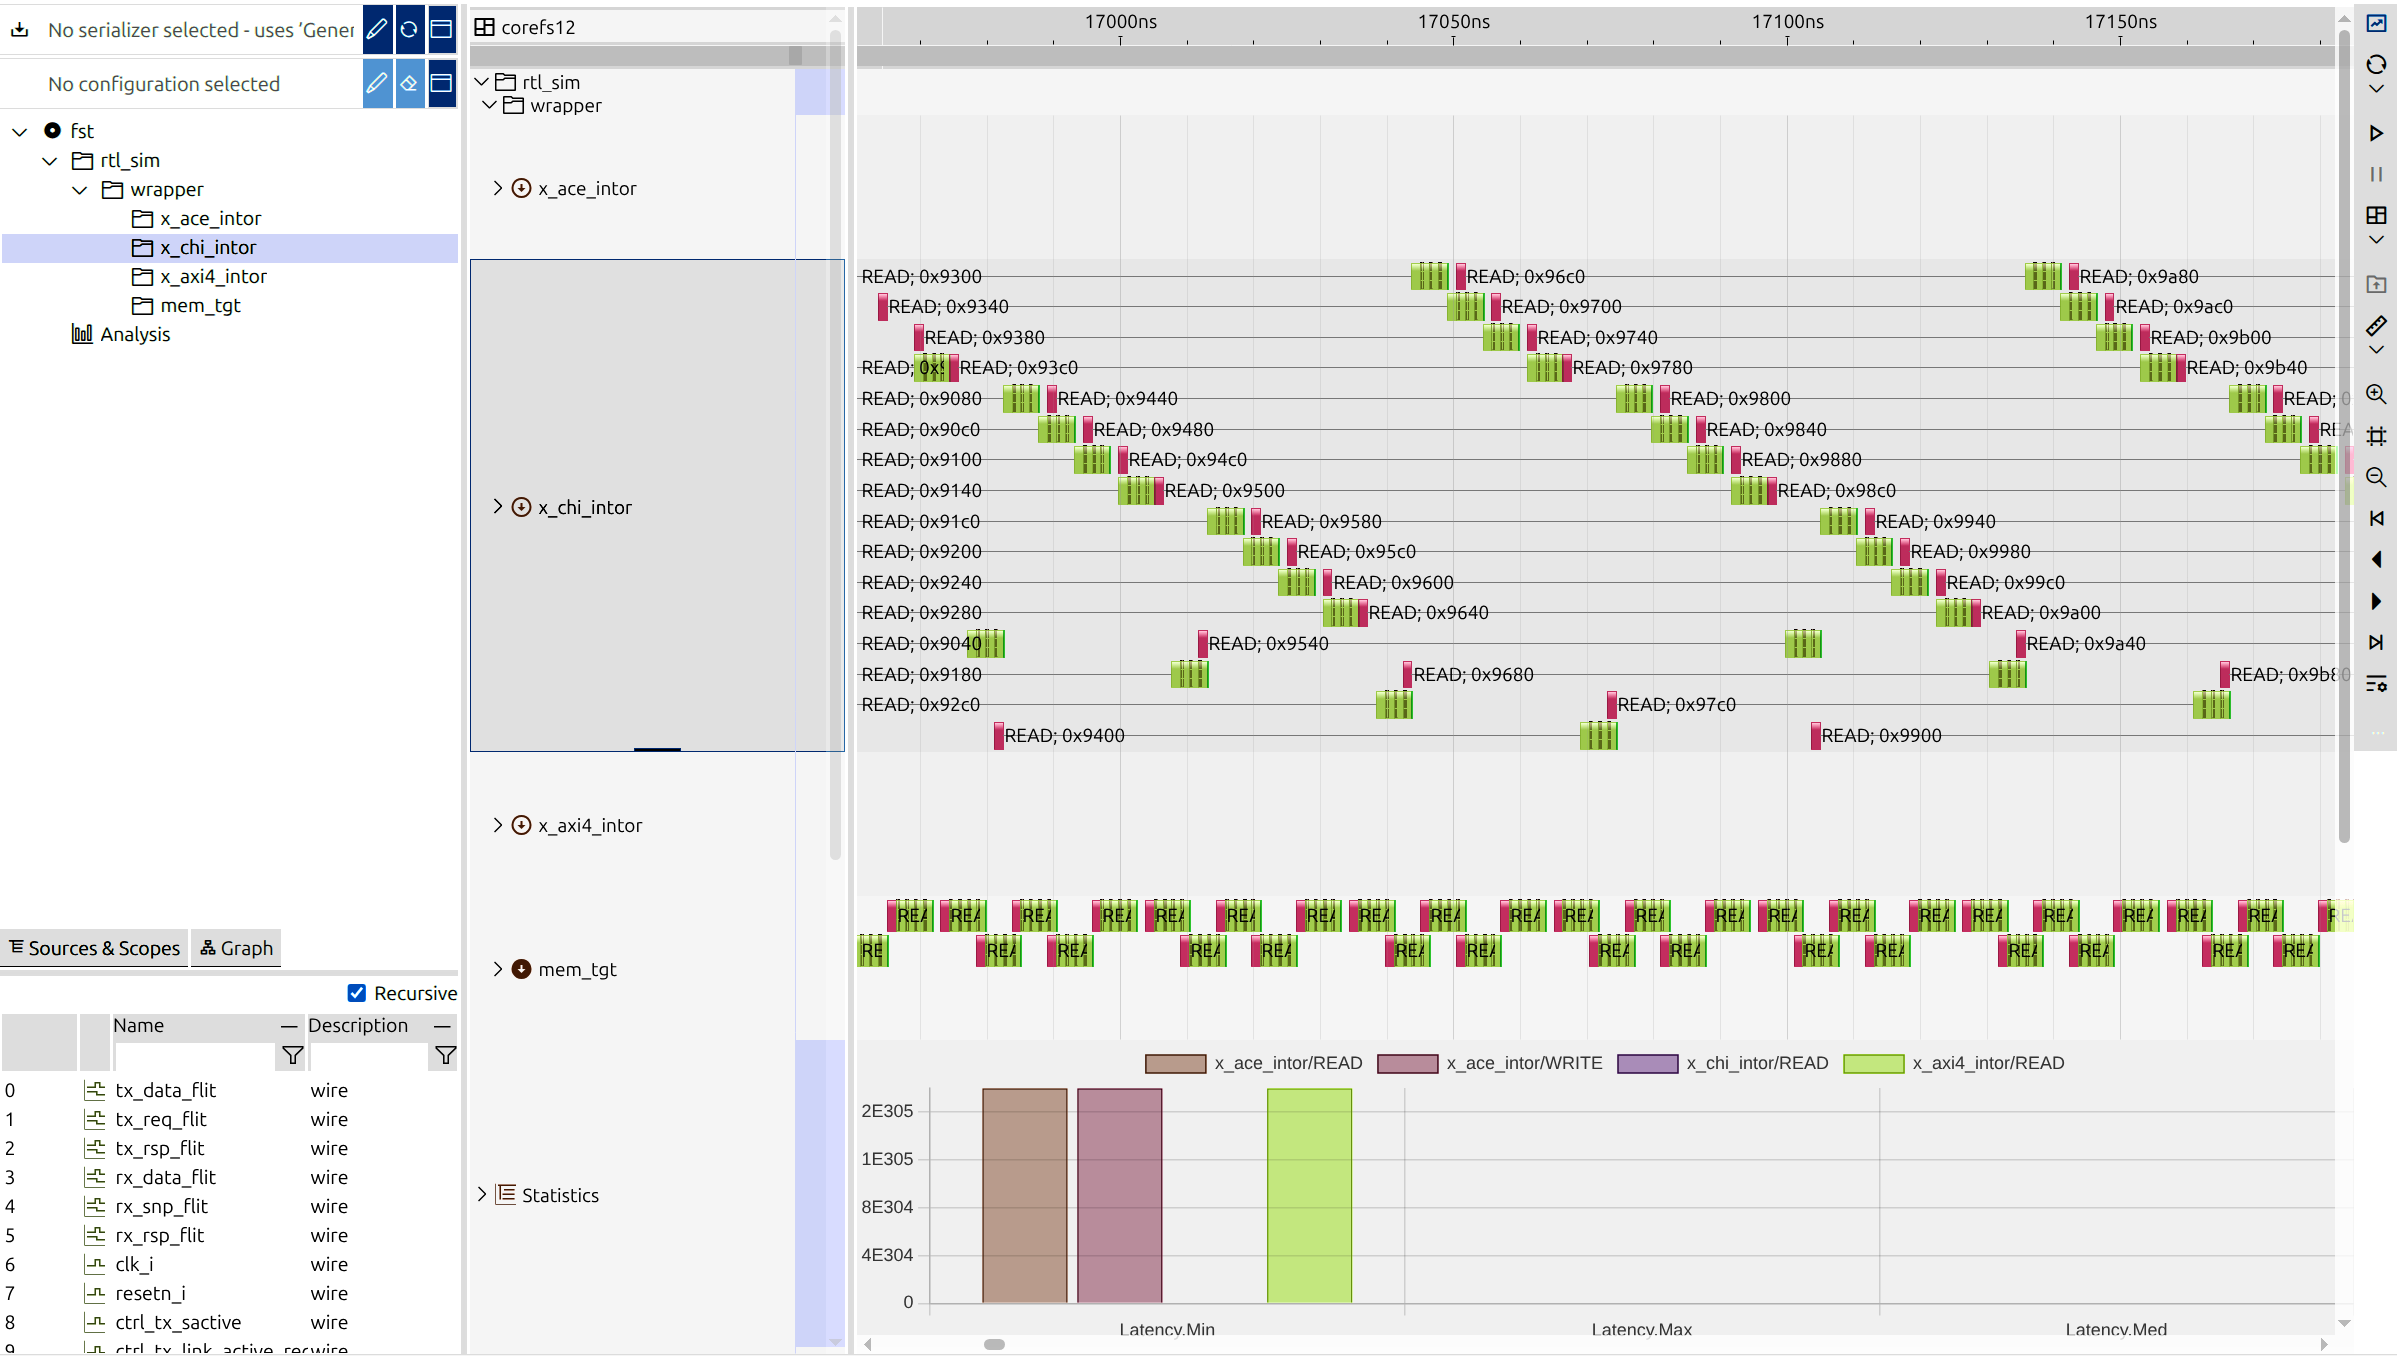
Create Gantt-style timelines showing transaction lifecycles, overlapping operations, dependencies, and resource utilization. Use command-specific views to filter by transaction type (read, write, snoop, coherent vs. non-coherent). Visualize relationships between transactions—cache line fills triggered by snoops, responses linked to requests, data transfers following address phases. Apply synchronized cursors across transaction and waveform views to correlate protocol-level behavior with pin-level timing.
Extract Performance and Compliance Metrics
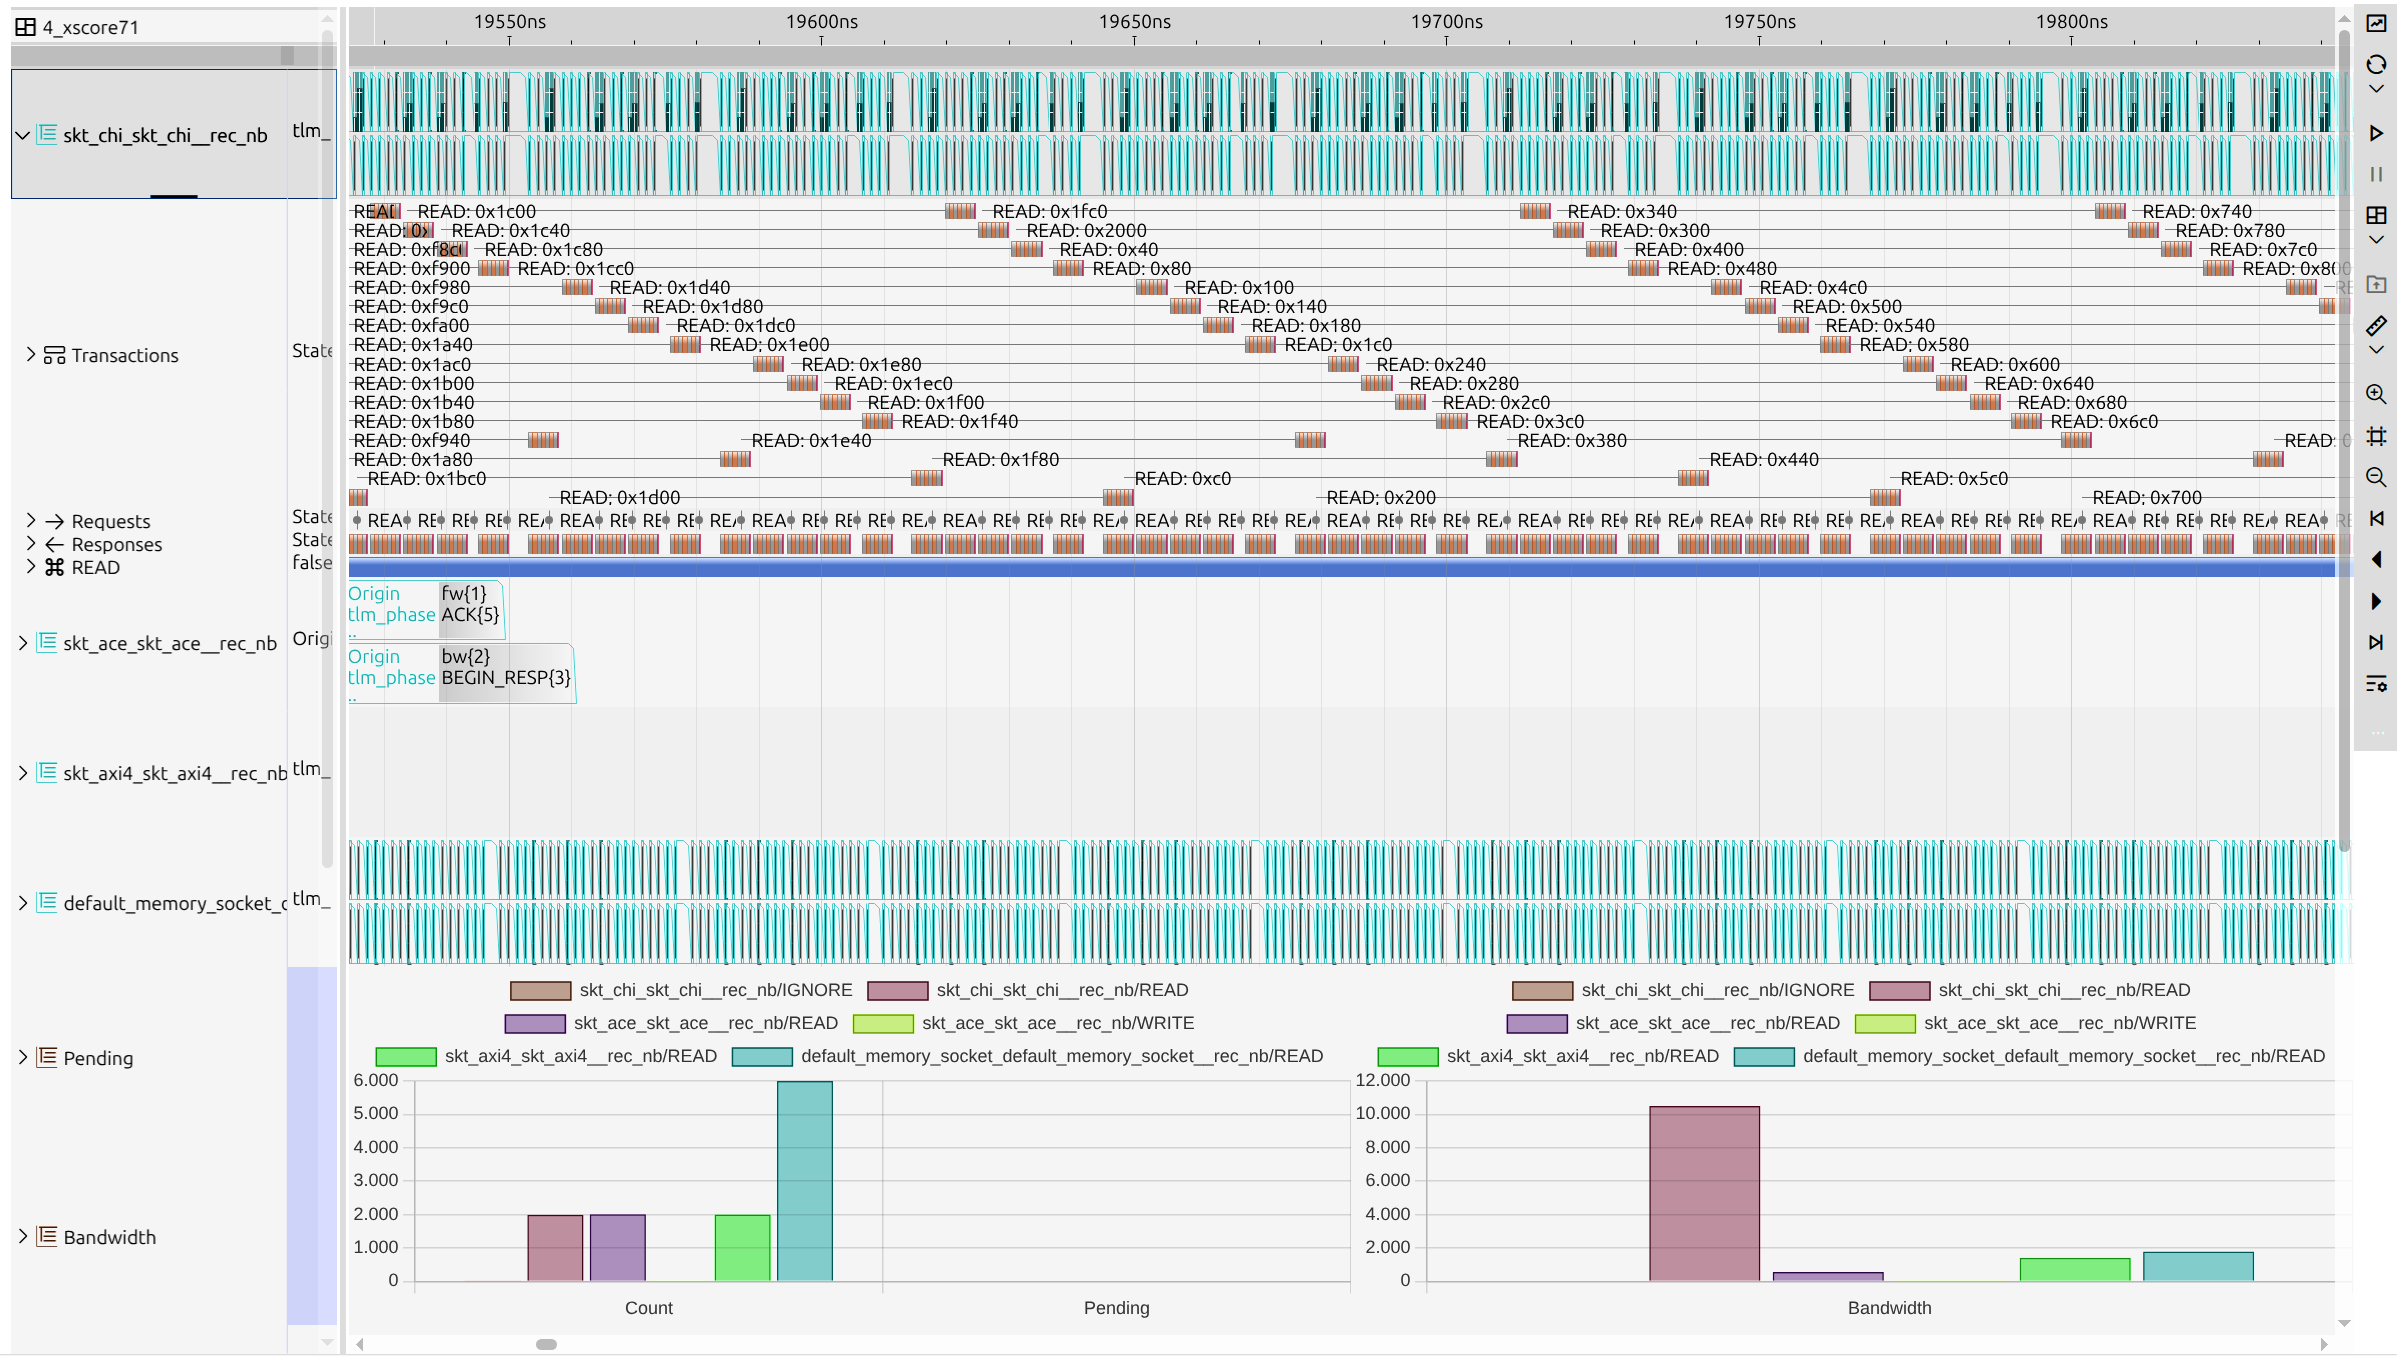
Measure bandwidth utilization, latency distributions, and burst efficiency across protocol channels. Analyze pending transaction queues to detect resource exhaustion and potential deadlock conditions. Track QoS behavior, priority escalation patterns, and atomic operation sequences. Generate statistics on transaction completion times, identify performance outliers, and validate protocol compliance. Compare actual performance against theoretical limits to pinpoint optimization opportunities.
Automatic Transaction Extraction
Reconstruct high-level transactions from low-level pin signals automatically. See complete read/write operations with all associated attributes instead of manually correlating handshakes and tracking IDs. Focus on semantic operations rather than individual signal transitions, accelerating debugging of protocol-level issues.
Multi-Channel Correlation
Complex protocols involve multiple parallel channels (request, response, data, snoop). Automatically correlate activity across these channels, presenting unified transaction views. Handle split transactions, out-of-order responses, and interleaved data beats seamlessly for comprehensive protocol analysis.
Cache Coherency Protocol Support
For coherent systems, track shareability domains, snoop operations, cache state transitions, and data forwarding. Understand how coherency mechanisms maintain consistency across the system. Debug cache-related issues by visualizing snoop-induced invalidations, cache line migrations, and data transfers.
Bandwidth and Throughput Metrics
Calculate actual bandwidth utilization across protocol channels. Identify periods of congestion and measure sustained throughput over time windows. Compare against theoretical maximums to pinpoint performance bottlenecks. Analyze how efficiently available bandwidth is being utilized by different transaction types.
Latency Distribution Analysis
Measure transaction latencies from request initiation to final response completion. Visualize latency distributions to identify outliers causing performance problems. Track latency trends over time to detect performance degradation patterns. Correlate high-latency transactions with concurrent system events.
Pending Transaction Monitoring
Monitor transaction queues and outstanding request counts in real-time. Detect resource exhaustion before it causes system failures or hangs. Identify potential deadlock conditions by analyzing circular dependencies between masters and slaves. Debug buffering strategies and credit-based flow control mechanisms.
Gantt-Style Transaction Timelines
Visualize transaction lifecycles on interactive timelines showing overlapping operations, dependencies, and resource utilization patterns. Quickly identify concurrency patterns, serialization bottlenecks, and idle periods. Use zoom and pan controls to explore different time scales and transaction details.
Command-Specific Filtering
Separate and filter transactions by command type, coherency attributes, or custom criteria. Focus analysis on specific operation categories relevant to your debugging task. Create custom views showing only transactions matching specific patterns or conditions.
