RN03 Intensity Chart (NEBULA)
Outline
Nebula Visualization is a widgets library for data visualization in science, engineering and SCADA areas. An intensity diagram represents the input data as colored dots in a cartesian plane (e.g. for the representation of temperature patterns).
| Platforms: |
|
|||
| Requirements: |
|
|||
| Known limitations: |
|
|||
| Status: |
|
|||
| Extensibility: |
|
|||
| Supported signal types: |
|
|||
| Chart Parameters: |
|
|||
| Plot Parameters: |
|
 32/64bit
 32/64bit
 32/64bit
Compatible signal data
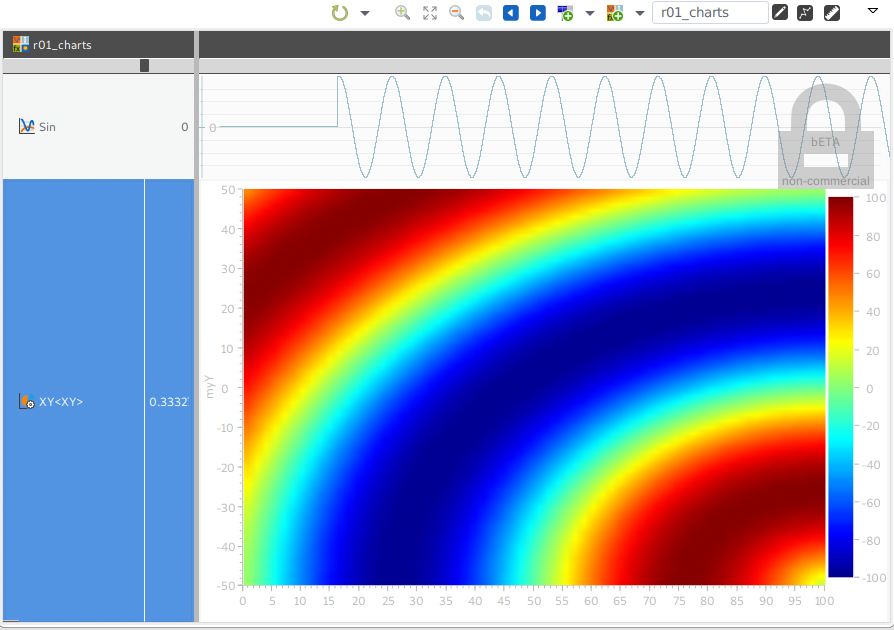
The Intensity chart provider supports simple numerical signals.
Chart Configuration
You can modify the chart behavior under Preferences->impulse->Charts.
- You may add own charts or chart variants
- Modify existing charts (Chart Parameters)
- Options: Show Legend.
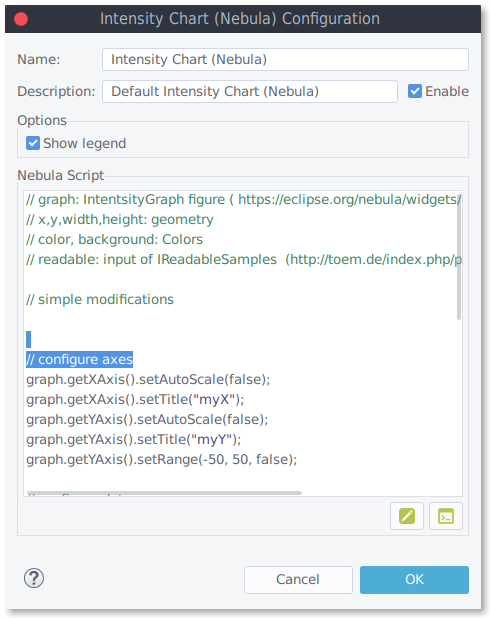
You can extend the Intensity chart using scripts. To achieve this you have access to the nebula graph object.
	// graph: XYGraph figure ( https://eclipse.org/nebula/widgets/visualization/visualization.php)
	// x,y,width,height: geometry
	// color, background: Colors
	// readable: input of IReadableSamples

	// simple modifications
	graph.primaryXAxis.setAutoScale(false);
	graph.primaryXAxis.setTitle("my x");
	graph.primaryYAxis.setAutoScale(false);
	graph.primaryYAxis.setTitle("my y");
	graph.primaryYAxis.setDashGridLine(true);
	graph.primaryYAxis.setShowMajorGrid(true);
The Intensity chart provider does not conatin any data handling. The script shall load the sample data into the chart:
	// configure data
	graph.setMax(100);
	graph.setMin(-100);
	var dataHeight = 64;
	var dataWidth = 64;
	graph.setDataHeight(dataHeight);
	graph.setDataWidth(dataHeight);

	// create simulation data
	var simuData = java.lang.reflect.Array.newInstance(java.lang.Integer.TYPE, dataWidth * dataHeight * 2);
	var i,j,seed = 1;
	for (i = 0; i < dataHeight; i++) {
	    for (j = 0; j < dataWidth; j++) {
	        var xn = j - dataWidth;
	        var yn = i - dataHeight;
	        var p = Math.sqrt(xn * xn + yn * yn);
	        simuData[i * dataWidth + j] = Math.sin(p * 2 * Math.PI / dataWidth + seed * Math.PI / 100) * 100;
	    }
	}
	graph.setDataArray(simuData);
Plot Configuration
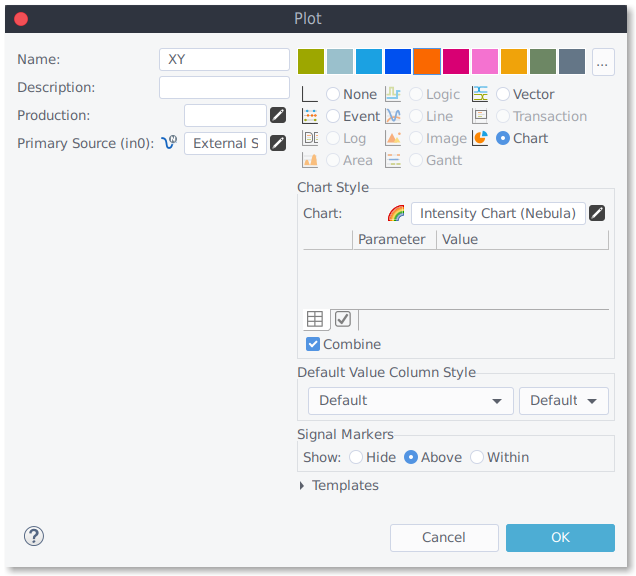
To display a chart in a given plot:
- Configure production/source to gain a compatible signal
- Set the plot type to "Chart",
- Configure the charts plot parameter ("Chart Style").