RYA2 State Chart Plot (YAKINDU)
Outline
YAKINDU Statechart Tools (itemis) offer an integrated modeling environment for the specification and development of reactive, event-driven systems based on the concept of state machines. The state chart plot allows the display of the current states (on- or offline data) at the current cursor position.
| Platforms: |
|
|||
| Requirements: |
|
|||
| Known limitations: |
|
|||
| Status: |
|
|||
| Extensibility: |
|
|||
| Supported signal types: |
|
|||
| Chart Parameters: |
|
|||
| Plot Parameters: |
|
|||
| Tutorials: |
 32/64bit
 32/64bit
 32/64bit
Compatible signal data
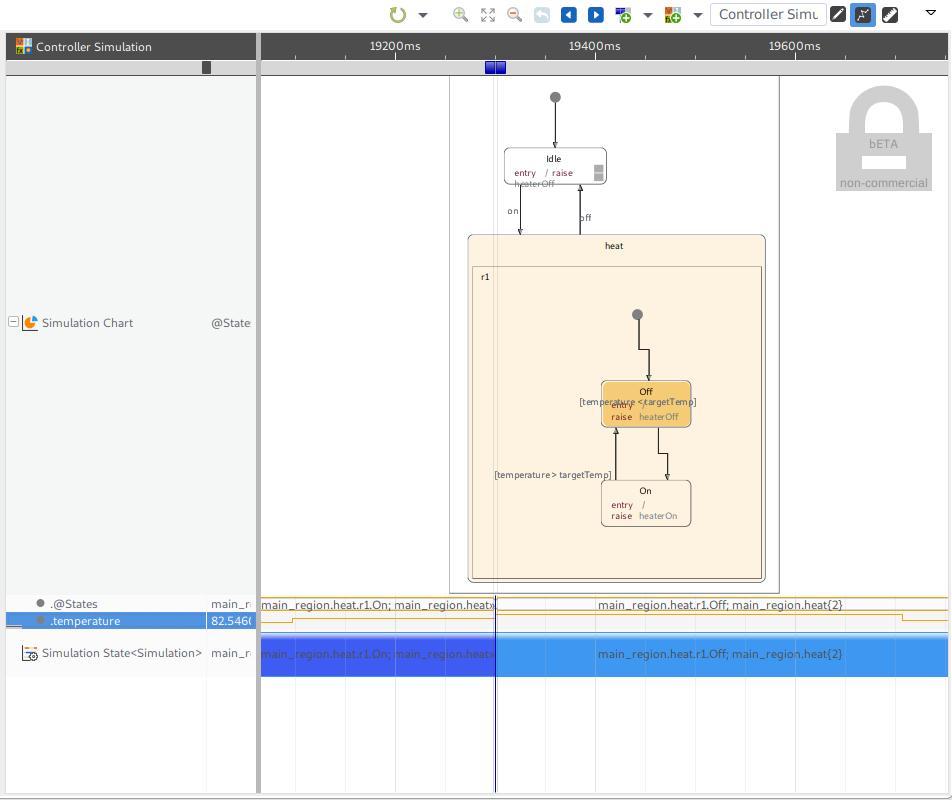
The State chart chart provider supports textual and struct signals. Struct signal need to contain a textual member with "state" content descriptor. Unlike other charts, the state chart plot does not show the signal data. Instead, it will highlight the current states at the active cursor position. To make this work, the input for the plot must either be data relating to the production or a trace containing the state changes (e.g., from an embedded target).
- Text and Event(Enumeration) signals : Will be used as current state information.
- Struct: Text and Enumeration members with "state" content descriptor: Will be used as current state information.
Chart Configuration
You can modify the chart behavior under Preferences->impulse->Charts.
- You may add own charts or chart variants
- Modify existing charts (Chart Parameters)
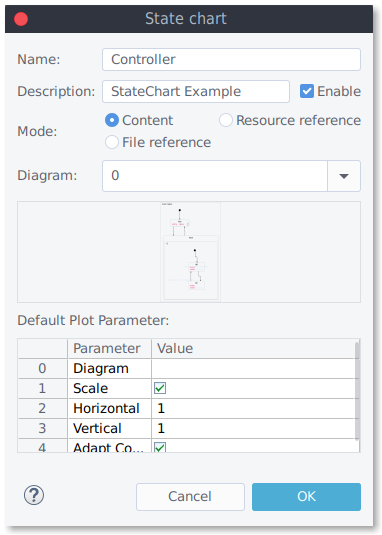
- Mode: Content, Resource reference, File reference.
- File/Resource: Select the model SCT file/resource.
- Synchronize on Re-load: If checked, a re-load of a viewer will force synchronisation of the chart with its resource/file .
- Diagram: Enter a name (if model contains multiple diagrams).
- Below name and description fields, you will find the mode settings.
- Content: The start chart model is loaded into this chart and will not change (in the case of typical demo use);
- Resource reference: You can select a resource, targeting a model SCT file. After selection, the model is loaded and stored with the chart. If the “Synchronize on reload” flag is checked, the chart is synchronized in case of model updates. You may use the “Synchronize now” button to load the model manually;
- File reference: This is the same as the resource reference but targets a system file.
Plot Configuration
To display a chart in a given plot:
- Configure production/source to gain a compatible signal
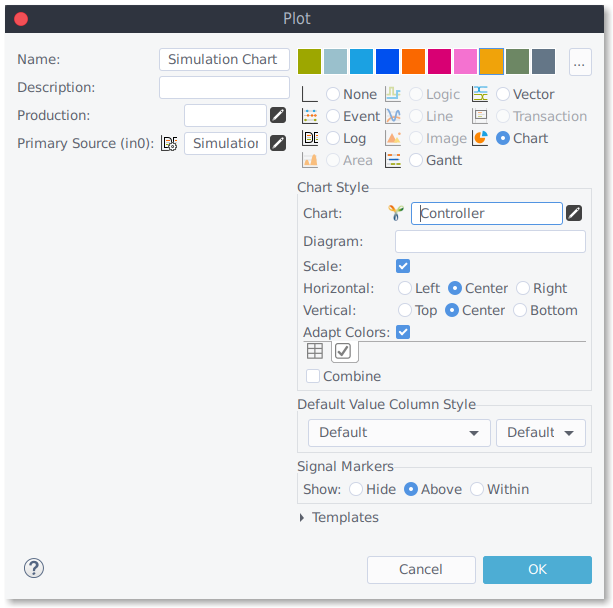
- Set the plot type to "Chart",
- Configure the charts plot parameter ("Chart Style").
- Diagram: Enter a name (if model contains multiple diagrams).
- Scale: Scale chart to fit width/height.
- Horizontal: Select horizontal alignment.
- Vertical: Select vertical alignment.
- Adapt colors: Adapt colors to improve visibility for light/dark background.