U002 Custom diagrams and charts - IQ Constellation
 impulse provides
lots of diagrams, presentation options and charts. In addition, users can extend these
visualisation options. The article guides through typical extension scenarios using image diagrams
and script charts.
impulse provides
lots of diagrams, presentation options and charts. In addition, users can extend these
visualisation options. The article guides through typical extension scenarios using image diagrams
and script charts.
With the term diagram, impulse describes the different types of build-in visualisation types. Beside charts, all types are drawn along a domain line (usually time-line) and can be scrolled and zoomed.
Charts are of special type. Charts are not bound to any impulse axis, instead charts are just using the window width for full presentation (if combine flag is checked, charts will share the window width).
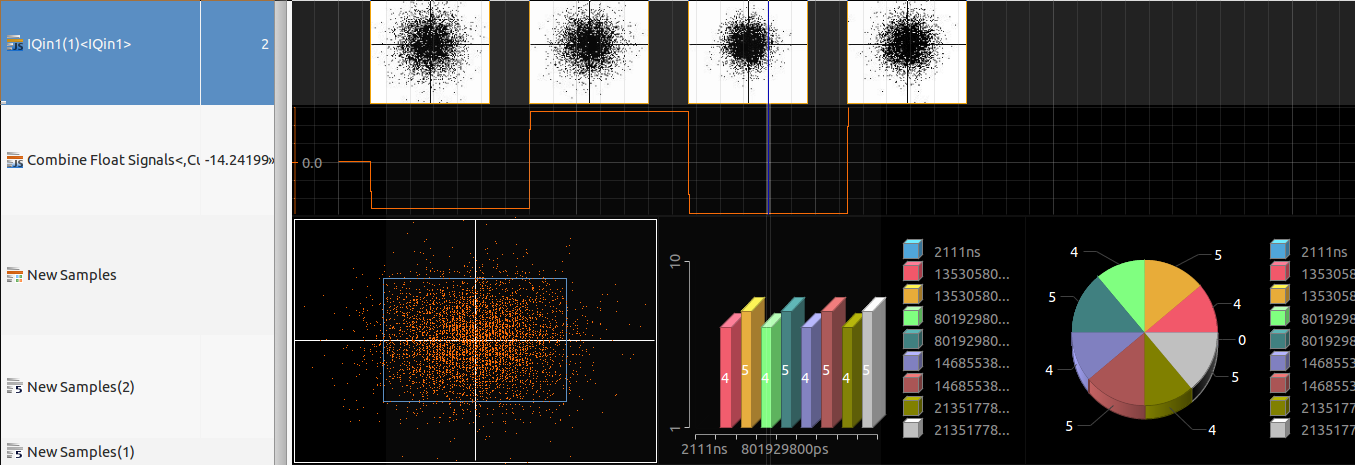
Below you find two examples. The first is drawing a constellation diagram along a time line. The second one (and the easier) uses a script chart.
Constellation diagram along a time-line
In this example, we want to draw constellation diagrams along a time line (for each slot - 5120 samples).

To realize , I used a binary signals together with the image diagram. Lets start with the script:
// input: an array of all input signals
// in0: primary input of type ISamplePointer,IReadableSamples
// in1<:ISamplePointer,IReadableSamples,Object:> first additional input (in2,..) of type ISamplePointer,IReadableSamples
// out: output signal of type InnnnnSamplesWriter with nnnnn=signal type
// javadoc at http://toem.de/images/toem/impulse/javadoc/index.html

importPackage(Packages.org.eclipse.swt);
importPackage(Packages.org.eclipse.swt.widgets);
importPackage(Packages.org.eclipse.swt.graphics);
importPackage(java.io);
importPackage(java.lang);

// iterate input samples - each sample is a byte array
for (var iter  =  new SamplesIterator(input);iter.hasNext();){
    var current<:Long:> = iter.next(); // current domain position

    // display
    var display<:Display:> = Display.getDefault();

    // run in main thread
    var ev=null;
    var r = new java.lang.Runnable( { run: function () {
		try{

	        // image / gc
	        var w = 128;
	        var h = 128;
	        var image<:Image:> = new Image(display, w, h);
	        var black = display.getSystemColor(SWT.COLOR_BLACK);
	        var white = display.getSystemColor(SWT.COLOR_WHITE);
	        var gc<:GC:> = new GC(image);
	        gc.setBackground(white);
	        gc.setForeground(black );

	        // preapre
	        gc.fillRectangle(0, 0, w, h);
	        gc.drawLine(0,h/2,w,h/2);
	        gc.drawLine(w/2,0,w/2,h);

	        // data
	        var data = in0.val();

	        // paint
	        var n;
	        for (n=0;n = new ByteArrayOutputStream();
	        var loader <:ImageLoader:>= new ImageLoader();
	        loader.data = (typeof load == 'function') ?
                java.lang.reflect.Array.newInstance(ImageData.class,1):
            	java.lang.reflect.Array.newInstance(ImageData,1);
	        loader.data[0] = data;
	        loader.save(stream, SWT.IMAGE_JPEG);
	        stream.close();

	        // write image data
	        out.write(current, false, stream.toByteArray());
		}catch(e){ev=e}
    }});
    display.syncExec(r);
	if (ev)
		throw(ev);

}
Using the graphics context
One problem that occurred was that i wanted to use the graphics context. This needs to be done from the main thread. We could do without and modify the image data directly, but using the gc is more comfortable.
The following snippet does the trick. It binds the code that uses the gc into a Runnable object and calls the syncExec method of the display.
Exceptions that occur in the runnable are getting re-directed. Otherwise they get visible in the error log.
    // run in main thread
    var ev=null;
    var r = new java.lang.Runnable( { run: function () {
		try{
	....
		}catch(e){ev=e}
    }});
    display.syncExec(r);
	if (ev)
		throw(ev);

}
Preparing the image
This code is standard swt code and nothing special. It creates an image of given size, and a gc for the image.
After creation, the image is cleaned and simple axes are painted.
        // image / gc
        var w = 128;
        var h = 128;
        var image= new Image(display, w, h);
        var black = display.getSystemColor(SWT.COLOR_BLACK);
        var white = display.getSystemColor(SWT.COLOR_WHITE);
        var gc = new GC(image);
        gc.setBackground(white);
        gc.setForeground(black );

        // prepare
        gc.fillRectangle(0, 0, w, h);
        gc.drawLine(0,h/2,w,h/2);
        gc.drawLine(w/2,0,w/2,h);
Painting i/q samples
The data is given in from of a binary array. 2 bytes for each integer, so 4 bytes for one i/q sample.
After extracting the i and q values, x and y of the resulting point is calculated. gc.drawPoint(x,y) does the rest.
      // data
        var data = in0.val();

        // paint
        var n;
        for (n=0;n<data.length;n+=4){
            var i= (data[n]&0xff) | (data[n+1]<<8);
            var q= (data[n+2]&0xff) | (data[n+3]<<8);
            var x = i / 512 * w/2 + w/2;
            var y = q / 512 * h/2 + h/2;
            gc.drawPoint(x,y);
        }
Encode image
An image diagram requires a binary signal. Each images shall be encoded as png, jpeg or gif image, and inserted as byte array into the signal.
Encoding is done by using ImageLoader.loader.save(stream,type).
        // dispose image / get image data
        gc.dispose();
        var idata = image.getImageData();
        image.dispose();

        // create png
        var stream= new ByteArrayOutputStream();
        var loader = new ImageLoader();
	        loader.data = (typeof load == 'function') ?
                java.lang.reflect.Array.newInstance(ImageData.class,1):
            	java.lang.reflect.Array.newInstance(ImageData,1);
        loader.data[0] = data;
        loader.save(stream, SWT.IMAGE_PNG);
        stream.close();
The complicated line above (loader.data = ...) was required due to incompatibility between rhino (up to jre6) and Nashorn java script engine (from jre7).
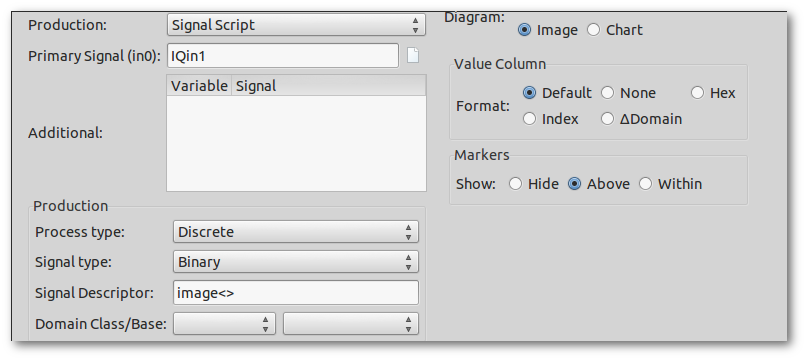
To use the script, create a new samples configuration item in your viewer, select the input as primary signal, select Script production, paste the script into the text field and select Image as diagram type.
Constellation diagram as chart
This example uses a script chart. The example is much more easier as we don't need to create images, we just need to paint into the given graphics context!
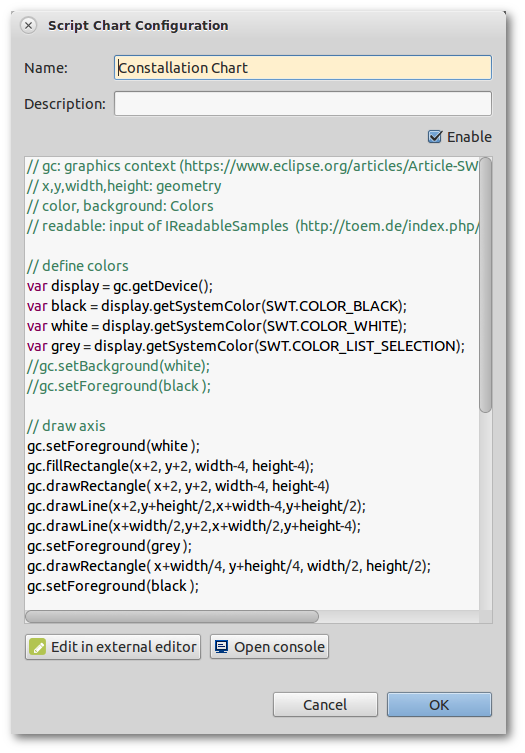
To get started, create a new Script Chart (in Preferences->Charts) and paste the script below. Then create a new samples configuration item in your viewer, select the input as primary signal, and select Chart as diagram type.
// gc: graphics context (https://www.eclipse.org/articles/Article-SWT-graphics/SWT_graphics.html)
// x,y,width,height: geometry
// color, background: Colors
// readable: input of IReadableSamples  (http://toem.de/index.php/projects/impulse/scripts/reference)

// define colors
var display = gc.getDevice();
var black = display.getSystemColor(SWT.COLOR_BLACK);
var white = display.getSystemColor(SWT.COLOR_WHITE);
var grey = display.getSystemColor(SWT.COLOR_LIST_SELECTION);

// draw axis
gc.setForeground(white );
gc.fillRectangle(x+2, y+2, width-4, height-4);
gc.drawRectangle( x+2, y+2, width-4, height-4)
gc.drawLine(x+2,y+height/2,x+width-4,y+height/2);
gc.drawLine(x+width/2,y+2,x+width/2,y+height-4);
gc.setForeground(grey );
gc.drawRectangle( x+width/4, y+height/4, width/2, height/2);
gc.setForeground(black );

// draw data points
gc.setForeground(color );
for (var i =0;i<readable.getCount();i++){

	// get data array
	var data = readable.valueAt(i);

    // paint
    var n;
    for (n=0;n<data.length;n+=4){
        var i= (data[n]&0xff) | (data[n+1]<<8);
        var q= (data[n+2]&0xff) | (data[n+3]<<8);
        var px = x+  i/512 * width/2 + width/2;
        var py = y+  q/512 * height/2 + height/2;
        gc.drawPoint(px,py);
    }
}